3/1/2021
Opportunities Abound!
Dr. Marvin N. Miller
While not as giddy as a kid in a candy store when presented with new data about our floriculture industry, I do get excited when the opportunity presents itself. It’s not about the opportunity to crunch some numbers; instead, the data offer a guide to where opportunities lie. And when presented with the 543-page (plus appendices) 2019 Census of Horticultural Specialties, the revealed opportunities abound!
At times like these, I’m reminded of Vic Ball, long-time editor of GrowerTalks, who also was a pilot, and he was quick to compare industry data to a plane’s compass. He recognized that many growers receiving government questionnaires filled them out by “recollecting” what they’d grown and what their sales might have been, rather than going through their sales records or checking in with their accountants. (After all, this was before most operations had computers.)
For every grower that might have overestimated their sales, there was probably another who underestimated their success, so he knew the data weren’t 100% accurate. He also knew that some didn’t fill out government questionnaires, even though the Census has always been a mandatory survey (and the USDA can fine folks for not responding). Nevertheless, Vic would compare the data to a compass in a plane that wasn’t reading due north quite accurately. He’d say, “I’d still rather have that compass than fly the plane without one!”
Similarly, the once-every-five-year effort that the Census of Horticultural Specialties provides is a view of our changing floriculture industry. The data may not be 100% accurate, but the trends that are uncovered can reveal a lot about where we’re headed as an industry. The data also can challenge individual entrepreneurs to examine their own production and sales efforts to see what opportunities might be available that are currently being missed and/or provide reassurances to others justifying their individual niches for doing something out of the mainstream. An effort as simple as comparing the product mix of a firm by percentages with those of the national (or state) averages can raise food for thought, and perhaps, provide a compass for the future.
 Just released in December 2020, the 2019 Census of Horticultural Specialties from the U.S. Department of Agriculture’s National Agricultural Statistics Service (USDA/NASS) offers the most recent and most comprehensive snapshot of the $5.545 billion floriculture subsector. Covering all 50 states, the floriculture subsector is the largest of the horticultural specialties surveyed, accounting for 40.2% of the $13.779 billion in farm gate sales in the survey. Nursery crops ($4.545 billion) and the turf subsector ($1.272 billion) were other important segments, as were sales of propagative and pre-finished horticultural materials ($720.4 million) and food crops grown under protection ($703.5 million). Sales of all other horticultural specialty subsectors tallied $993.6 million.
In comparison, the 2014 Census of Horticultural Specialties reported just $10.1 million more in sales than the 2019 total, at $13.789 billion, but the floriculture subsector, at $5.880 billion, was 42.6% of the 2014 total. Thus, the floriculture subsector’s sales were down about 5.7% over the 2014 to 2019 span. Though the data source doesn’t reflect this, a number of facilities transitioned into cannabis production as various states legalized either medical and/or recreational use of marijuana and USDA legalized the production of hemp nationally.
Indeed, when comparing the reported total greenhouse production space utilized in 2014 to 2019, there were sharp declines in greenhouse space utilized by operations focused on the production of annual bedding/garden plants (over 31.5 million square feet less) and cut flowers (over 20.1 million square feet less), and only moderate increases in greenhouse space utilized by operations focused on the production of herbaceous perennials (up about 2.4 million square feet), potted flowering plants (up about 2.7 million square feet), foliage plants (up about 3.0 million square feet) and cut cultivated greens (up 0.1 million square feet).
 There were 10,939 operations reporting floriculture sales—nearly 53% of the total 20,655 respondents to the entire 2019 Census of Horticultural Specialties. This compares to 12,415 operations with floriculture sales in 2014; these operations accounted for almost 53.5% of the total number of respondents to this earlier survey (23,221). In 2019, nearly three-fourths (74.6%) of all floriculture operations (8,165 firms) reported sales of bedding/garden plants, with nearly 82% reporting sales of annuals and almost 63% reporting sales of herbaceous perennials. These numbers compared to 77.4% of all floriculture producers reporting sales of bedding/garden plants in 2014, with 83% reporting sales of annuals and 67% reporting sales of perennials in this earlier survey.
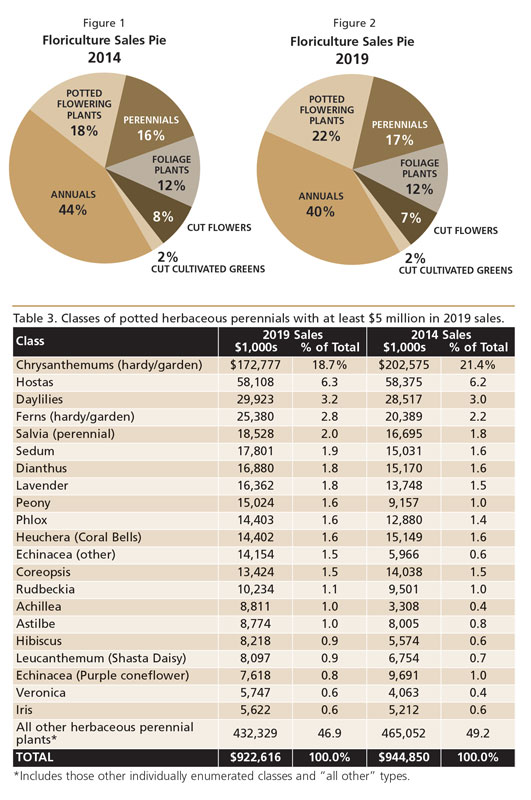
Bedding/garden plants represents the largest segment of the floriculture subsector. In 2019, this included $2.244 billion in sales of annuals and $922.6 million in sales of herbaceous perennials. Compared with 2014, sales of annuals were off 12.6%, while sales of perennials were off 2.4% in 2019 (Figures 1 and 2). Overall, the bedding/garden plant slice of the Floriculture Sales Pie was down 9.8% in sales from 2014 to 2019. The mix of annuals and perennials shifted slightly to more perennials in 2019, with perennials accounting for 29% of the total in 2019 compared to 27% in 2014.
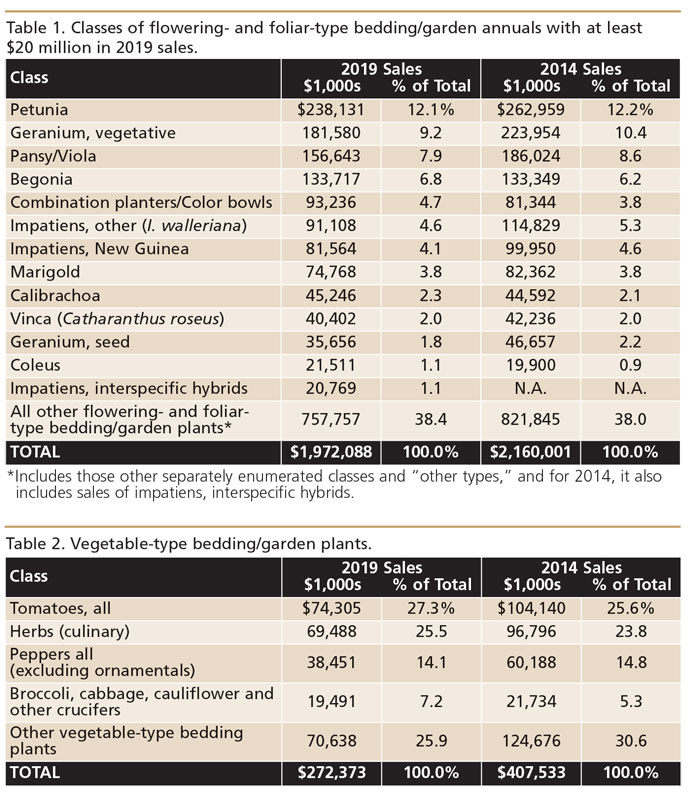
In 2019, sales of flowering- and foliar-type bedding/garden annuals tallied $1.97 billion in sales. There were 52 separately enumerated classes in the list, yet “other flowering and foliar types” still accounted for nearly 26% of the sales in the category. There were only 13 classes with at least $20 million in sales in 2019 (Table 1).
There were also $272.4 million in sales of vegetable-type bedding/garden plants reported in 2019, a third less than the $407.5 million reported in 2014 (Table 2). In total, vegetable-type bedding/garden plants represented 12.1% of the total dollars of annuals in 2019, down from representing 15.9% of total dollars of annuals in 2014.
In 2019, sales of flats of annuals accounted for 32.2% of all the dollar sales of annuals, while 51.2% of sales were from the sale of potted 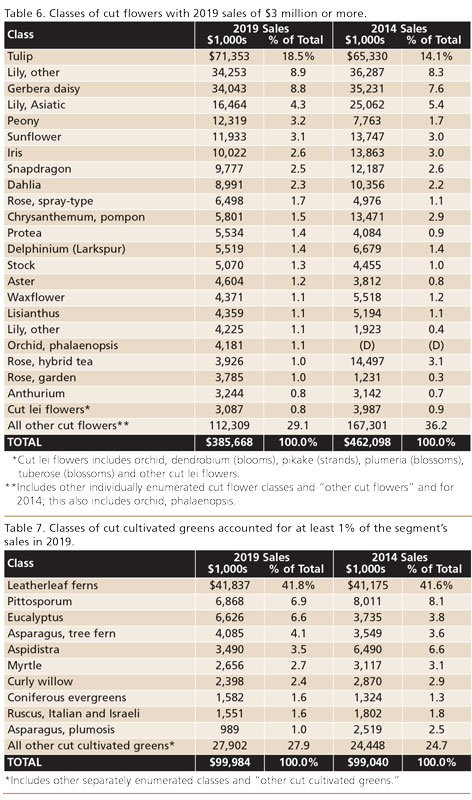 annuals and 16.7% were from the sale of hanging baskets. The first two categories contrasted with the sales of annuals in 2014, when sales of flats of annuals accounted for 34.6% of all the dollar sales of annuals and 48.7% of sales were from the sale of potted annuals. Like in 2019, sales of hanging baskets also accounted for 16.7% of dollar sales of annuals.
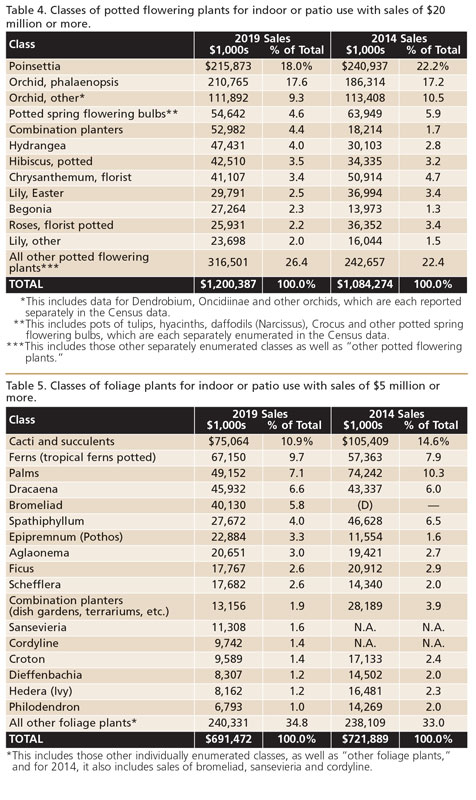
In 2019, sales of herbaceous perennials amounted to $922.6 million or about 29% of the bedding/garden plant sales. By far, the largest class in the perennial market is hardy/garden chrysanthemums, which accounted for 18.7% of all perennial sales. Following garden mums, there is a list of 42 other separately enumerated perennial classes, the largest of which, hostas, accounted for only 6.3% of 2019 perennial sales (Table 3).
After the bedding/garden plant segment, the second largest floriculture segment in terms of both dollars and number of operations is the potted flowering plants piece of the industry. Indeed, 3,977 operations, 36.4% of all floriculture firms, contributed to the $1.20 billion in sales of potted flowering plants in 2019. This compares to 4,059 operations, 32.7% of floriculture firms, which reported $1.08 billion in sales for this segment in 2014. So, unlike the bedding/garden segment, the potted flowering plant segment saw an increase in sales from 2014 to 2019 of 10.7%. The 2019 Census separately enumerates 34 classes of potted flowering plants (Table 4).
The third major segment of the “Floriculture Sales Pie” is foliage plants and 2,336 operations reported sales in 2019 valued at $691.5 million. This was a drop in producer numbers of 11.6% from 2014’s 2,644 operations and a decline in sales of 4.2% from $721.9 million. While these trends might seem surprising in light of the increased demand for foliage plants in the last few years, remember that the Census captures the industry at a point in time. Florida experienced multiple hurricanes over the five-year span between the 2014 and 2019 Censuses, which did impact the foliage production regions. Production could now indeed be surging to meet the demand.
The 2019 Census individually enumerated 22 classes of foliage plants. Still, the “other foliage plants” captured 32.9% of the segment’s total value. Foliage plant sales are reported for both potted foliage and for foliage hanging baskets. In 2019, 92.6% of the units and 89% of the sales value were derived from potted foliage sales, while 7.4% of the units and 11.0% of the sales value were from foliage hanging basket sales.
When compared to 2014, sales ratios were slightly altered, with potted foliage accounting for 94.3% of the total units, and 89.7% of the sales value and foliage hanging baskets accounting for 5.7% of the units and 10.3% of the sales value in the earlier survey (Table 5).
The fourth major segment of the Floriculture Pie is cut flowers. In 2019, there were 2,035 operations reporting sales of $385.7 million of cut flowers and cut lei flowers. This compares to the 1,998 producers who reported sales of $462.1 million in 2014. The 1.9% increase in producer numbers with the 16.6% decline in total revenues for this segment indicates that the average cut flower producer declined in size from $231,280 in sales to $189,517 in sales (an 18.1% decline in average size) over the five-year 2014 to 2019 period.
In 2019, the Census enumerated 65 separate cut flower classes and another five cut lei classes. Still, “other cut flowers” accounted for over 17% of the total value of the segment and other cut lei flowers accounted for over one-third of the lei flower units. Lei flowers collectively were less than 1% of the segment’s value (Table 6).
The last little less-than-2% sliver of the Floriculture Sales Pie is the cut cultivated greens segment, which for 2019, reported the sales of 644 operations at $100 million. In 2014, the Census reported the sales of 728 operations at $99.0 million. Thus, sales increased about 1% over the five-year stretch, even though there were 11.6% fewer businesses involved.
There were 29 individually enumerated cut greens classes in the 2019 Census. Leatherleaf fern was by far the largest class with sales of $41.8 million; this item accounted for 41.8% of the segment’s sales. At the opposite end of the spectrum, the 10 least important of the individually enumerated classes collectively accounted for less than 1% of the segment’s sales. Still, the “other cut cultivated greens,” which weren’t individually enumerated, accounted for 22.6% of the sales in the segment (Table 7). Still, the “other cut cultivated greens,” which were not individually enumerated, accounted for 22.6% of the sales in the segment.
The 2019 Census of Horticultural Specialties offers many more data points worthy of comparison. There’s an entire section of tables with state data, which would allow businesses to compare their individual situations with others in-state or possibly across state lines to determine if other nearby opportunities exist. Indeed, if charting one’s course, these data can serve as beacons for the future.
What’s in an estimate?
In the map, 23 of the 50 state values have an asterisk indicating the total value for that state was estimated. While true, it should be noted that less than 3% of the survey’s total floricultural value was estimated and that more than 97% of the total came from figures reported by USDA’s National Agricultural Statistics Service (USDA/NASS).
When reporting data, NASS’s mandate is to guard the privacy of all respondents. Their general operating rule is to not disclose total units or value if there are so few respondents (usually less than five) in a cell of data (think of a cell in an Excel spreadsheet, for example). In addition, if there are five or even more respondents, but there’s one dominant producer, then again, NASS will suppress the data. In the actual report, these data cells are indicated with a “(D)” to indicate there was a disclosure issue.
As the author reviewed the data for each of the floriculture industry’s main segments (cut flowers, potted flowering plants, foliage plants, bedding/garden plants and cut cultivated greens), it was possible to provide a “best-guess estimate” for these missing data either due to figures provided by state for specific crops within the segment and/or based on the number of producers for that segment in the states with disclosure issues. GT
Dr. Marvin N. Miller is market research manager for Ball Horticultural Company. During his 37 years at Ball, Marvin has worked with USDA/NASS to help them understand the industry and its data needs, while also working with the industry to improve its use of available data. Marvin currently serves on a USDA/NASS Advisory Committee on Agricultural Statistics.