

Welcome to River Ridge, says Mr. Snowman.
Up! (at least over last year) is the headline for the Third Annual River Ridge Holiday Greens Report, brought to you by the fine folks at Sun Gro Horticulture.
You know how this works: Laurie and I drive the streets of our 356-home middleclass neighborhood counting wreaths, garland, swags, Santas, elves, lights, plastic candles, inflatable snowmen (and Snoopys and Minions) to see how winter holiday decorating compares to spring gardening and Halloween. More importantly, we want to see how many of our neighbors are buying agricultural products—fresh-cut greens, in other words.
We did this year’s drive a couple days after Christmas, when it was a balmy 5F in Chicagoland, definitely a record for the coldest River Ridge Report ever (last year it was in the high 20s, and in 2015 it was in the 40s and drizzly). Still, it wasn’t bad out, and we spent much of the time with the windows cracked open for better visibility. Unlike the spring and fall reports, when Laurie drives and I count, I let her do the greens counting, as her employer, Clesen Brothers, sells the stuff, and she can tell real from fake from 100 yards.
The data
In a nutshell, overall decorating for Winter 2017 was up over 2016, with some 273 homes (77%) having some form of real or plastic decoration, and just 83 neighbors being Scrooges. That compares to 256 decorators (72%) and 101 Scrooges in 2016.
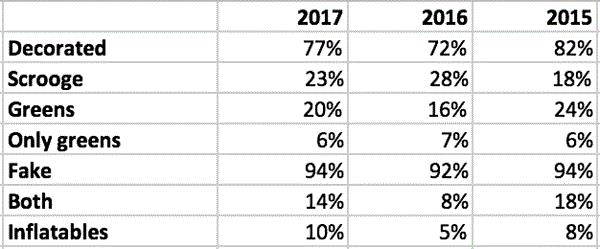
Unfortunately, 2017 isn’t the high point: In the 2015 inaugural greens report, 82% of homes had decorations—that’s 18 more homes. Perhaps December was a bit warmer for decorating; this year we had good light-hanging weather around and just after Thanksgiving, but then it turned bitterly cold, and that may have deterred some folks.
When it comes to greens, our favorite category, 55 homes (20%) that were decorated had some form of real, fresh-cut greens. That’s up from 16% last year, but down from 24% in 2015. Interestingly, the number of homes that had ONLY greens—no plastic decorations at all—has remained consistent at 6%/7%/6% over the three years of the survey. I guess that shows that those purists who only decorate with the real stuff remain loyal to their aesthetic (you could lump us into that category; although we do wrap our front door garland with white lights).
The choice of greens bought this year is interesting. In 2015, wreaths were No. 1, with 49 of 69 folks (71%) having them. Last year, that dropped to 23 out of 40 (57.5%). This year, we again counted 23 wreaths, out of 55 homes with greens (42%). Without data, one would guess that wreaths would be the most popular greens item, but nope.
This year, that title goes to garland: We counted long ropes of garland at 25 out of 55 homes (45.5%). That’s up from 15 homes (37.5%) last year and 14 homes (20%) the year before. Not sure why garland has gained in popularity, but there you go!
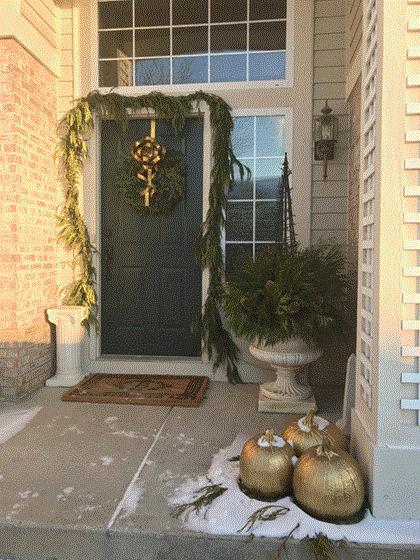
Lots of garland at this home.
Also up—in fact, way up—are pots of greens. We counted them at 20 homes (36%). That’s up from 12 homes (30%) and 13 homes (19%) the previous two years. I credit our local Home Depot, which had an enormous display of mixed greens containers at various price points spread across the apron all season long. Laurie confirmed that most of what she saw probably came from that display, which is the closest to River Ridge. Maybe the garland came from there, too.
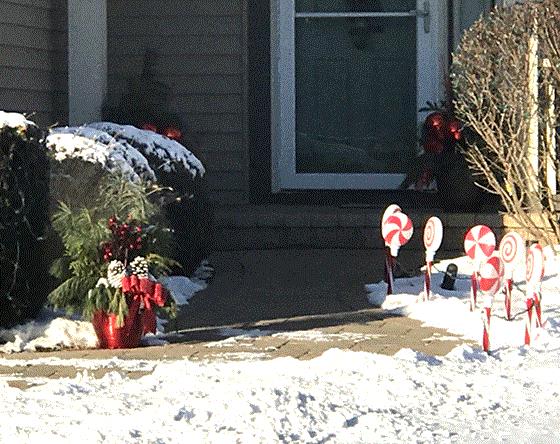
At Left is an example of the popular premade mixed greens containers we spotted at many homes. There are two more by the front door.
Lastly, swags, usually dangling from house lights but occasionally serving as a wreath: we counted 5 this year, compared to 3 last year and 6 in 2015. Then there were the random greens items, like crosses (1) and candy canes (1). We also spotted two mailboxes bedecked with greenery. In 2015 we saw a bit more random greens décor, including kissing balls, window boxes and hanging baskets. But perhaps the convenience of those grab-and-go containers from Home Depot have replaced some of the other items.
How does Christmas compare to spring and fall?
In a word, it dominates. We’ve long known that Christmas is the No. 1 decorating holiday, in dollars. But it’s been said that Halloween is gaining on it. Maybe so in expenditures, but in participation, winter is king, with 77% participation, compared to 66% of my neighbors decorating for fall.
Alas, spring gardening came in third in 2017, at 58%. However, it’s not so bleak when you consider that spring gardening is made up of 100% agricultural products, while agriculture only accounts for about 58% of fall decorating, and 20% of winter décor. So it could be worse!
Fall merges with winter
Once again I painted my fall pumpkins gold, turning them into Christmas ornaments that last for months (provided they freeze, that is!).
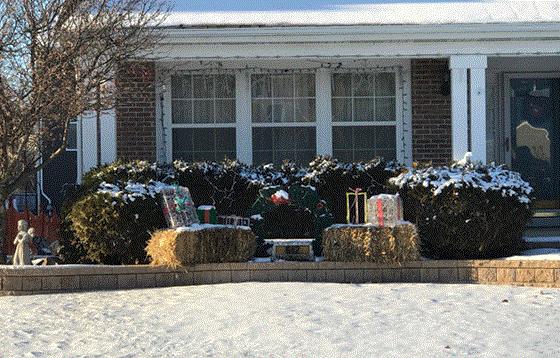
Well, I spotted another neighbor that used fall hay bales to create this winter scene, proving that fall expenditures on our products can be a great value! You just need to share ideas with your customers.
Got ideas, thoughts or impressions about the survey? Done your own informal neighborhood survey? Drop me a line at beytes@growertalks.com.