3/1/2021
A Geographic Look at Floriculture Sales
Dr. Marvin Miller
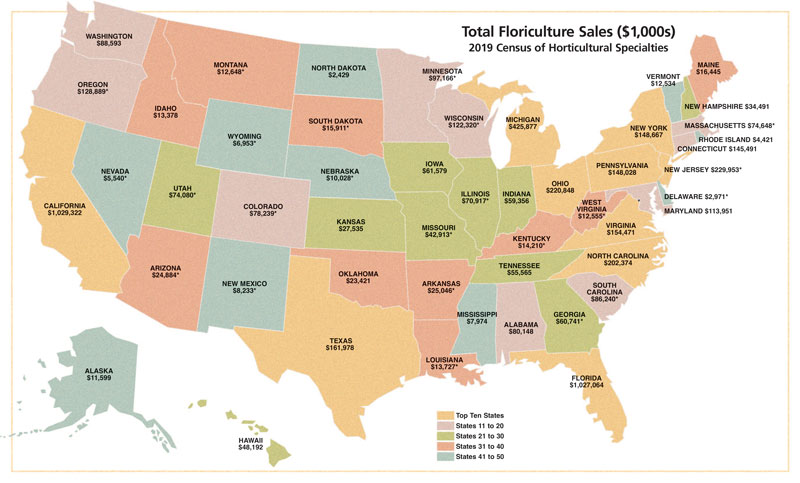
*These state totals are estimated due to disclosure issues for one (or more) segments of the industry. See page 54 for more information.
Every five years, the U.S. Department of Agriculture’s National Agricultural Statistics Service conducts a Census of Horticultural Specialties. The 2019 Census data were just released in mid-December and here are results for floriculture sales. Several things stand out: 1) Top states tend to hover around population centers, with several northeastern states accounting for the biggest block of production and the Great Lake states (New York, Pennsylvania, Ohio, Michigan, Indiana, Illinois, Wisconsin and Minnesota) collectively accounting for more sales dollars than even California, our No. 1 state; 2) the rankings on the map look surprisingly different than one might expect, largely the result of significant floriculture crops space diverting to cannabis production in recent years; 3) the range of sales values is dramatic, with two states, #1 California and #2 Florida, both registering over $1 billion in sales, and two states, #49 Delaware and #50 North Dakota, both coming in at less than $3 million (but still more than $2.4 million each).
The map, much like the Census, is a snapshot of a point in time. The 2020 sales data would look remarkably different because of the surge in sales most operations experienced as a result of COVID-19. Still, the 2019 data reveal the concentration of our industry’s sales into a group of top states, with the realization that even smaller states do have an industry measured in the millions of dollars at the wholesale (or farm gate) level. These two extremes speak both to the sales power of certain growers who sell to those who reach the masses and the importance of other producers that are needed to present our industry’s product opportunities to those who might be in less-populated locales. GT