9/30/2026
Where Your Irrigation System & Fertilizer Matter
Alvaro Daniel Pantoja-Benavides, Mayra A. Toro-Herrera & Rosa E. Raudales

This article is part of a special ASHS series, “Bridging Research & Practice,” featuring an article adapted from an ASHS journal publication that presents academic horticultural research directly to industry professionals. To learn more about ASHS please visit, ashs.org.
Every time you irrigate a container crop, some of that water can leave the pot carrying nutrients with it. We know that. What’s harder to understand is what that loss actually means from a water-quality standpoint.
One way to put a number on it is the gray water footprint (GWF). The GWF asks a simple question: How much clean water would be needed to dilute a pollutant in your runoff enough to meet a specified water-quality threshold?
For example, imagine 26 gallons of runoff containing 400 ppm nitrate-N. If the target concentration is 10 ppm, roughly 1,000 gallons of additional clean water would be needed to dilute that runoff to the target concentration.
That number changes dramatically depending on the water-quality threshold you use. A value appropriate for drinking water is much more restrictive than one based on what a crop can tolerate. This calculation can be applied to any chemical such as plant growth regulators. That’s what makes GWF useful—it gives us a common way to compare production systems and chemical losses, even when the systems themselves operate very differently.
We put three irrigation systems head to head
We used GWF to compare three common irrigation systems and two controlled-release fertilizer rates in greenhouse-grown petunias. We grew Petunia milliflora Picobella Pink in 8-in. containers filled with 700 g. of a peat-based substrate and either the full label rate of Osmocote Plus 15-9-12 (14 g. per pot) or 85% of the label rate (12 g. per pot).
The irrigation systems were overhead mist, drip and sub-irrigation using flood trays with a recirculating tank. All three systems were managed to the same irrigation container capacity target. The plants were irrigated three times per week and before each irrigation we weighed the pots and adjusted the irrigation time so the containers reached 110% of container capacity. We repeated the experiment twice.
The result was pretty clear: Irrigation system mattered. Fertilizer rate did not.
Reducing the controlled-release fertilizer rate by 15% did not produce measurable differences in plant growth, nutrient leaching or GWF. Irrigation system, on the other hand, affected almost everything we measured (Figure 1).
Water in: The biggest difference was the amount of water needed to reach the same container capacity target. Over the crop, drip used about 84 gallons per pot, sub-irrigation about 132 gallons and mist about 660 gallons. Mist used so much water because not all the water coming out of an overhead system ends up in the container. Some lands on foliage, the bench and the surrounding greenhouse surfaces. More water has to be applied to get the same amount into the root zone.
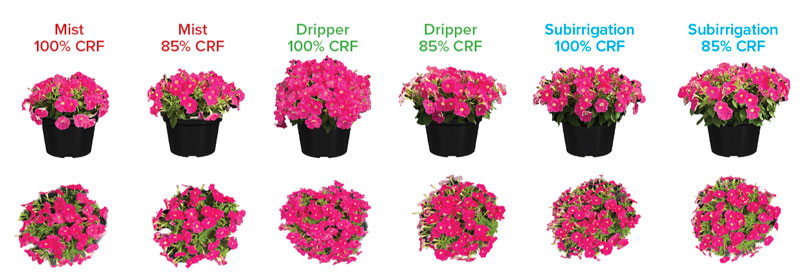
Figure 1. Plants at the end of the experiment. (CRF = controlled-release fertilizer.)
That is an important distinction: Two systems can deliver the same moisture target to the crop while using very different amounts of water.
Water out: The differences continued after the water entered the pot. Mist produced about 0.15 to 0.20 gallons of leachate per pot per week. Drip produced about 0.08 to 0.13 gallons. Sub-irrigation produced no discharge from the greenhouse because the irrigation solution was collected and recirculated. That doesn’t necessarily mean the nutrients disappeared—it means they stayed in the system.
Bigger plants, less water
Sub-irrigated plants were the largest, followed closely by drip-irrigated plants. Mist-irrigated plants were the smallest. Leaf color was similar among the irrigation treatments. In other words, using substantially less water didn’t produce an inferior crop in this trial.
Water-use efficiency told the same story. Drip produced about 4 g. of dry matter per gallon of irrigation water, sub-irrigation about 3 g. and mist about 0.4 g.
Look out for phosphorus
Here’s where the GWF really gets interesting: The nitrogen concentration in the runoff was higher than the phosphorus concentration. But phosphorus drove the GWF because the reference water-quality threshold used for phosphorus was much lower.
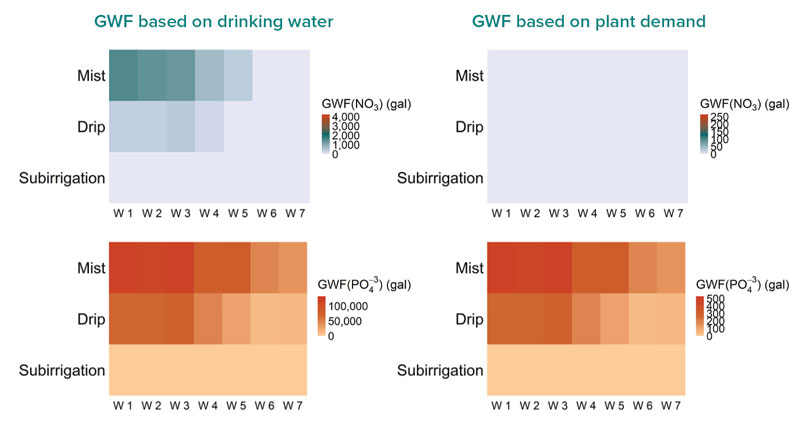 Under mist irrigation, leachate reached concentrations of about 120 ppm nitrate-N and 30 ppm phosphate-P. Under drip, concentrations were about 40 ppm nitrate-N and 25 ppm phosphate-P. So phosphorus, not nitrogen, determined how much clean water would theoretically be needed to dilute the runoff to the selected water-quality threshold.
Figure 2. Gallons of clean water needed each week to dilute the runoff from 1,000 finished 8-in. petunias back to acceptable levels. Left column uses EPA drinking water limits (10 ppm nitrate-N, 0.05 ppm phosphate-P); right column uses what the crop itself tolerates (150 ppm nitrate-N, 10 ppm phosphate-P). Sub-irrigation is blank in every panel because the water recirculated and no runoff left the greenhouse. Nitrate under the crop tolerance standard is zero for all three systems since leachate never reached a level that would harm the plants.
Under the more stringent water-quality reference drinking water standard, the GWF for phosphorus reached roughly 84 to 110 gallons per pot per week under mist irrigation. Drip started substantially lower and declined during the crop as controlled-release fertilizer release slowed. When scaled to 1,000 finished 8-in. petunias, the difference becomes much easier to visualize. That’s what we show in Figure 2.
The important point is not that a grower literally needs to find millions of gallons of clean water to clean the runoff. GWF is a way to quantify the dilution burden created by the nutrients leaving a production system.
What happens when nothing leaves?
Sub-irrigation produced a GWF of zero because no irrigation water left the system as discharge. But zero discharge didn’t mean zero nutrient management.
As the crop progressed, nitrate-N in the recirculating tank increased from roughly 2 to 3 ppm to 8 to 10 ppm. Phosphate-P increased from about 1 to 3 ppm to 6 to 14 ppm. The nutrients were not leaving the greenhouse; they were accumulating in the irrigation water. That changes the management question.
With an open irrigation system, you worry about what’s leaving the greenhouse. With a recirculating system, you have to watch what’s building up in the tank.
A larger reservoir can provide more buffering capacity, while a small reservoir can concentrate nutrients more quickly. Growers also need to keep an eye on other parameters that may accumulate in recirculating irrigation water, such as salts, fungicides, water sanitizers, plant growth regulators and plant pathogens. This is one of the trade-offs of closed irrigation systems: You replace an external discharge problem with a water-quality management problem you control inside the greenhouse.
The 15% fertilizer cut
The other result was almost as interesting. Dropping the controlled-release fertilizer from 14 to 12 g. per pot didn’t change plant growth, leachate volume, nutrient concentrations or GWF in this trial. This is a simple, but important observation, as cutting any cost by 15% adds up to your margins.
How to use the GWF?
You don’t need to calculate a gray water footprint for every pot in your greenhouse to get useful information. Start with three measurements:
Know how much water the crop actually needs. Determine container capacity for your substrate and container size and use that information to set an irrigation target.
Measure water in and water out. An irrigation flow meter, combined with simple collection measurements from representative pots, can tell you how much water you’re applying and how much is leaving the container.
Look beyond EC. Electrical conductivity is useful for tracking soluble salts, but it doesn’t tell you specifically how much nitrogen or phosphorus is leaving the crop. Periodic leachate testing can show which nutrients are driving the problem. And if you recirculate irrigation water, monitor the tank. A system can have zero discharge and still develop a water-quality problem inside the greenhouse.
Take-home messages: The irrigation system may have more influence on your environmental footprint than the fertilizer rate. In this study, mist used substantially more water and generated more nutrient-rich leachate than drip or sub-irrigation. Sub-irrigation eliminated discharge altogether, while still producing plants comparable to drip irrigation. The GWF doesn’t tell you what system every grower should install; however, it gives you an exact number on the dilution rates needed to reuse water or to discharge, and provides direction as to where your next water-saving investment should go. GT
Alvaro Daniel Pantoja-Benavides, Mayra A. Toro-Herrera and Rosa E. Raudales conducted this study in the Department of Plant Science and Landscape Architecture at the University of Connecticut. The full study, “Comparative Analysis of Irrigation Type and Controlled-release Fertilizer Rates on the Gray Water Footprint and Plant Growth of Container-grown Petunias,” was published in HortScience 61(7):1451–1457 (2026). The work was supported by the USDA-ARS Floriculture and Nursery Research Initiative, USDA-NIFA Hatch Multi-state and partners of the Root Alliance.