8/31/2026
What Plants Are Customers Searching for & Where Is Breeding Still Open?
Chi D. Nguyen, Seth D. Wannemuehler & Mike A. Schnelle

This article is part of a special ASHS series, “Bridging Research & Practice,” featuring an article adapted from an ASHS journal publication that presents academic horticultural research directly to industry professionals. To learn more about ASHS please visit, ashs.org.
Which ornamental genera and traits offer enough consumer momentum to justify investment without entering an intellectual-property landscape so crowded that meaningful differentiation becomes difficult?
Every breeding program eventually faces the same difficult question: Where should the next five to 10 years of effort go? Grower experience, customer requests and historical sales remain essential, but they mostly describe what’s already known. They may not reveal where consumer attention is building or where the competitive space is already crowded.
Our recent HortScience study developed a Breeding Opportunity Index (BOI) to add that missing layer by combining U.S. Google Trends data with U.S. plant patent records. USDA production data provided the geographic context. The goal was to screen genera and traits before committing years of breeding, trial space or licensing resources.
Three signals, one screen
Consumer attention was measured using U.S. Google search activity from January 2004 through November 2025. The analysis covered more than 100 genera across bedding plants, flowering potted plants, foliage plants, cut flowers and greens, and landscape ornamentals. Patent records provided the second lens. We measured cumulative patent activity, the pace of recent filings and how concentrated ownership was among assignees from 2001 through 2025. We then combined the consumer-interest signal with patent-based intellectual-property openness to calculate the BOI.
Higher scores indicate a more favorable alignment between consumer attention and a comparatively open patent landscape. USDA production data added a third layer by showing where sales for each sector are concentrated geographically. Production geography was not included directly in the BOI because USDA data are reported mainly by broad commodity category rather than genus. Even so, it remains an important reality check when deciding where a crop can be trialed, propagated and distributed.
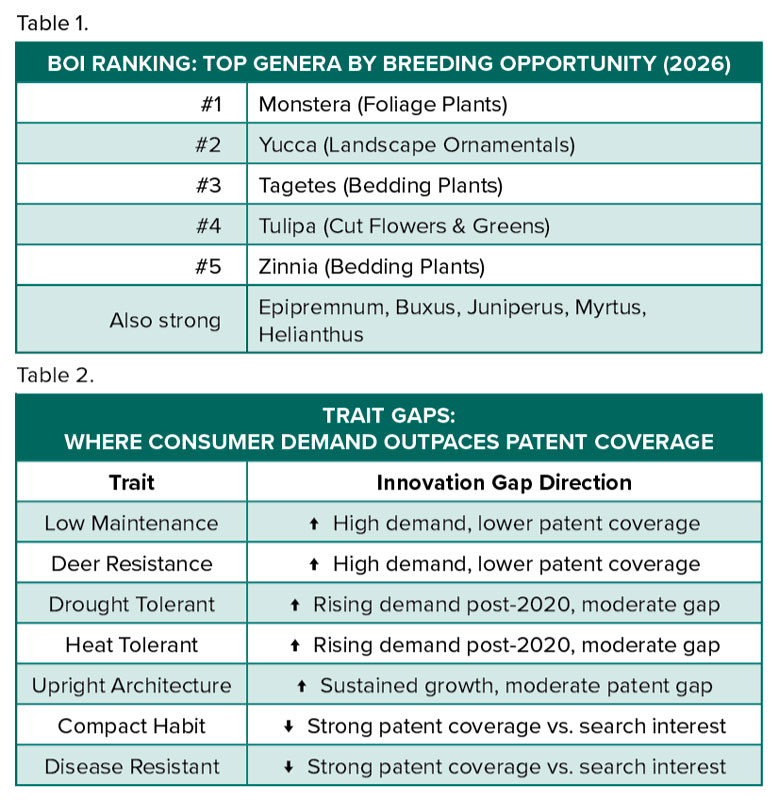 Foliage led the growth signal, but highly concentrated
All five ornamental sectors gained search interest over the study period, but foliage plants showed the strongest acceleration beginning around 2019 to 2020. The growth wasn’t evenly distributed across the category. Monstera produced the strongest genus-level growth signal, with philodendron also among the faster-growing taxa. Many other foliage genera showed much more modest change.
For growers and breeders, the distinction matters—”houseplants are growing” is too broad to guide investment. The commercially useful question is which crops are carrying that growth and whether that momentum is durable enough to outlast a social media cycle. Volatility helps with that interpretation. Salvia, dahlia, hydrangea and coleus all showed relatively high fluctuation in search attention.
Volatility isn’t automatically negative; it may reflect strong seasonal purchasing, episodic media exposure or a powerful promotional window. However, it should change how inventory decisions, launch timing and multi-year breeding investment are evaluated.
The patent map changes the picture
Rose, chrysanthemum, hydrangea and petunia occupied some of the most patent-saturated positions in the analysis. These are proven commercial crops with strong breeding activity and frequent cultivar turnover. They remain attractive targets for programs with scale and germplasm access to compete. However, new entries require sharper differentiation, a deliberate IP strategy and often a licensing or partnership arrangement.
Ownership concentration added a second warning flag. A crop can have relatively few patents, yet much of the protected space may be held by a small number of entities. That situation may create constraints around licensing, germplasm access and freedom to operate that raw patent counts alone would miss.
The traits consumers may be pulling for
Consumer search interest for low-maintenance performance, heat tolerance, drought tolerance and deer resistance has grown substantially, yet patent coverage for those traits remains comparatively thin. Compact habit and disease resistance show the opposite pattern, appearing frequently in patent language relative to their current search activity. Those traits still matter to production efficiency and crop quality; the comparison simply signals that those traits are already well represented in formal breeding and patent activity.
The broader message is that consumers are redefining what a better plant looks like. Color and form still sell, but shoppers increasingly search for plants that perform in hotter summers, survive with less water, stand up to deer and fit smaller spaces with less upkeep. The next successful introduction will likely need to deliver both visual appeal and a functional promise.
Putting the framework to work
The BOI does not require modeling to be useful. The same logic applies to everyday crop planning, supplier conversations and variety trials.
- Track search trends over time. A single year of search data means little. Sustained movement over several years, confirmed against your own orders, retailer requests and customer questions, is a signal worth acting on.
- Check the patent landscape before committing resources. A basic search reveals how crowded a crop is, who the active breeders are and how quickly new introductions are arriving. That context changes how you evaluate a licensing deal.
- Pair visual appeal with production performance. A distinctive plant is only an advantage if it also roots reliably, finishes on schedule and performs after purchase.
- Turn national trends into regional claims. Heat tolerance in Oklahoma and cold hardiness in Minnesota are different breeding targets. National search data should lead to local trial validation.
- Build the product story before the product is finished. Low maintenance and drought performance only become market advantages when they can be measured and communicated honestly.
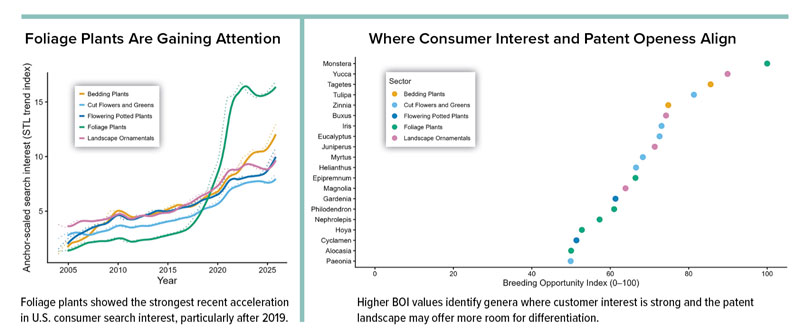 A better starting line
Breeding is a long and expensive commitment. Data integration does not replace the judgment of breeders, growers and marketers—it helps focus that judgment where opportunity appears strongest. Google Trends shows where consumer attention is moving, patent records reveal where breeding investment is concentrated and USDA data provide production context. The strongest targets are those where sustained interest, a navigable competitive space, workable crop biology and a clear path to market come together.
Consumer interest and patent openness may identify the opportunity. Crop biology, regional fit and production feasibility determine whether it’s worth pursuing. GT
Chi D. Nguyen is an Assistant Professor of Ornamental and Nursery Crop Plant Breeding in the Department of Horticulture & Landscape Architecture at Oklahoma State University. Mike A. Schnelle is the Charles & Linda Shackelford Endowed Professor of Floriculture in the Department of Horticulture & Landscape Architecture at Oklahoma State University. Seth D. Wannemuehler is an Assistant Professor of Woody Ornamental Plant Breeding & Genetics in the Department of Horticultural Science at the University of Minnesota. The full study is published in HortScience, 61(7):1419–1428 (2026).