7/1/2024
The Latest USDA Stats on Our Industry
Dr. Marvin Miller
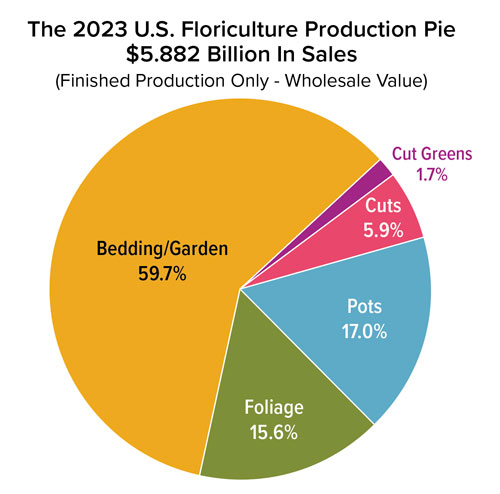
The U.S. Department of Agriculture’s National Agricultural Statistics Service (USDA/NASS) released its Floriculture Crops: 2023 Summary in late May and the numbers appear to support the reflective attitudes many expressed last year. Overall, the $5.882 billion in finished floricultural sales were down about 0.9% from 2022, yet the sales were still 4.0% higher than those recorded in this survey in 2021, the first year this survey covered all 50 states.
Segment-by-segment sales
USDA reports on segment-by-segment sales for growers reporting $100,000 or more in total sales.
■ Sales of domestically produced cut flowers increased 5.1% from 2022 to 2023, to $349.98 million; however, the 2023 sales were down about 2.1% from 2021.
■ Sales in 2023 of cut cultivated greens were down about 3.5% from 2022 to $97.78 million. Sales of cut greens in 2023 were off 7.3% from 2021.
■ Sales of potted flowering plants took the steepest year-to-year dive from 2022 to 2023, as sales were off 10.1%, dropping to $1.002 billion. Compared to 2021, sales of potted flowering plants in 2023 were off 2.8%.
■ Sales of foliage plants were up 11.2% in 2023 from 2022 to $918.85 million and these sales are up 21.1% from the 2021 level.
■ Sales of bedding/garden plants in 2023 were $3.514 billion, off 1.4% from 2022, but the sales volume still topped the 2021 level by almost 3.3%.
■ Sales of annuals in 2023 were $2.476 billion, up 0.3% from 2022, but up 4.5% compared to 2021.
■ Sales of perennials were $1.038 billion in 2023, off about 5.0% from 2022, but up 0.6% from 2021. Perennials were 30% of the total bedding/garden plant sales in 2023.
■ The Floriculture Crops Summary also covers propagative materials. In 2023, growers reported sales of $513.82 million in propagative materials; these sales were off about 0.1% from 2022, but they were up almost 1.0% from 2021.
Totals
For growers with sales of $100,000 or more, counting the plant propagative materials, 2023 sales were $6.396 billion. This was off about 0.9% from the 2022 level, but up 3.78% from 2021. In 2023, sales of growers with at least $10,000, but less than $100,000, were estimated to have been $294.5 million, up 24.4% from 2022 and up 17.2% from 2021. In sum, the total estimated sales for all growers in the survey in 2023 were $6.691 billion, up less than 0.01% from 2022, but up 4.3% from 2021.
Inflation
All of the above dollar changes from 2021 to 2023 do not take inflation into account. According to the U.S. Bureau of Labor Statistics, inflation, as measured by the Consumer Price Index (CPI) for all products from December 2021 to December 2022, ran about 6.4% and a year later, from December 2022 to December 2023, inflation was about 3.7%. All told, from December 2021 to December 2023, the CPI rose about 9.7%. GT