6/1/2024
A Comparison of the Latest Ag Statistics
Dr. Marvin Miller
The 2022 Census of Agriculture statistics, released by USDA’s National Agricultural Statistics Service, is a once-every-five-years survey of all U.S. agriculture, which provides a quick look at our floriculture industry. All agricultural producers with at least $1,000 in agricultural sales are surveyed, and if even $1 of their total sales are floriculture, then those dollars are captured in the Census data under floriculture. As such, we expect the sales to be higher than those recently reported from the 2022 Floriculture Crops Summary.
Total floriculture sales were reported as $7.473 billion in 2022 according to the Census, which contrasts to the $6.685 billion total in the Floriculture Crops Summary for the same year (2022). The largest share of the Census pie goes to bedding/garden plants, which were $4.259 billion, or 57% of the floriculture total sales. Potted flowering plants accounted for 17.6% of the total sales ($1.316 billion), followed by foliage plants with 13.4% of the total sales ($999.8 million). In the Census, cut flowers and cut greens are grouped; together these accounted for 10.2% of the pie and $763.0 million. Finally, there’s an “Other Floriculture” category, which accounted for $135.4 million and 1.8% of the total pie.
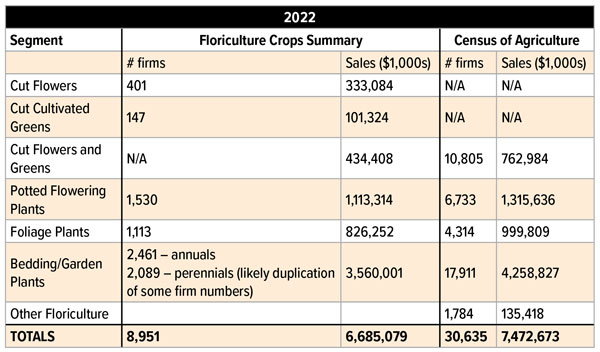 Comparing the two surveys as best as possible, we see that the Census recorded $787,594,344 more dollars, or about 11.8% more total sales, than the Floriculture Crops Summary. However, the Census reported 23.6% more dollars by the four industry segments than the Floriculture Crops Summary reported in the cut flower, cut greens, potted flowering plants, foliage plant and bedding/garden plant segments. (The smaller growers contribute estimated sales totals of about $237 million to the Floriculture Crops Summary sales total, but these sales aren’t identified by industry segment. In addition, the Floriculture Crops Summary includes over $514 million in plant propagative materials sales.) There were 21,684 more firms contributing to the Census sales numbers.
By segment, there were 75.6% more sales of cut flowers and cut greens reported in the Census, with perhaps nearly 20 times the producers reporting. There were 18.2% more sales of potted flowering plants, with 5,203 more firms reporting. There were 21% more foliage dollars with 3,201 more operations reporting. And the Census reported 19.6% more sales dollars in the bedding/garden plant segment with at least 13,361 more firms contributing to the sales totals.
In summary, the bedding/garden plant, foliage plant and potted blooming plant segments, in total, saw 19.5% more sales in the 2022 Census of Agriculture than in the 2022 Floriculture Crops Summary, suggesting that the Floriculture Crops Summary does indeed capture about 80% of the larger industry segments’ sales. However, for the cut flowers and cut greens segment, which saw 75.6% more dollars in the Census, there’s a tremendous underrepresentation of this segment’s sales in the annual Floriculture Crops Summary, which is a testament to the large number of small cut flower producers contributing to the U.S. cut flower supply. GT