12/30/2013
Is Your Greenhouse Profitable?
Barry Sturdivant
Quick—guess the median net profit margin for the wholesale greenhouse industry. We’ll get to the answer a little later, but I would be curious how close you are. (Hint: Recently published polling from the industry bears little resemblance to the data we’ve compiled and we’ve included a lot of truly exceptional growers.)
Historically, little has been known about the financial condition of the greenhouse industry as a whole. We generally don’t really know how the industry is doing or if an operation has a problem until we read about it going out of business. Does a business encounter financial trouble over time or does it happen suddenly? Are the troubled operations an aberration? Or are they leading indicators for an industry that needs to change? There’s been no way of knowing—until now.
With the help of our friends in the industry, we’ve compiled average and median financial ratios and other data derived from almost 50 wholesale greenhouse operations.1 The number of operations in the study helps ensure confidentiality. The data comes from all parts of the U.S. representing well over $1.5 billion in sales for each year from 2008 through 2012. What we’ve found is an industry still financially sound, but needing improved profit margins to remain viable in the long-term. (The example in this article is called “Median Greenhouse USA.”)
Part of the problem is market leverage. You don’t have any. Or maybe you do, but you act like you don’t, which is worse. The greenhouse industry is comprised of a lot of relatively small independent operators. Even if you’re a relatively large grower, you can be replaced by a smaller operation. Industry insiders are still buzzing about Walmart’s recent actions.
Those of us in agricultural lending are used to growers and farmers being price takers and getting thin margins for what they produce. We understand cycles and are used to seeing commodity prices occasionally straddle the breakeven point. But there are differences in the supplier/customer relationship between growers/shippers of fruits and vegetables versus the greenhouse industry. There are times when the farm price is below break-even for produce, but there are some built-in safeguards that even the playing field for them. Fruit and vegetable producers are protected by the Perishable Agricultural Commodities Act (PACA)2, which ensures they’re generally paid within 10 days of delivery. Additionally, subject to an eight-hour acceptance period, they get paid for everything they ship—and they ship whenever the produce is ready, regardless of weather. Your perishable plant material isn’t given this type of protection. Your risk in the delivered plant material is much greater, plus you have to provide more point-of-sale services. This is fine if you’re getting an adequate net return for the added risk and merchandising services. Are you?
Earnings, cash flow and the earnings illusion
Let me begin on a positive note and repeat that almost all of you are, in fact, profitable every year. However, net profits are low for both the average and median. Earlier, I asked you to guess the net profit margin. I’m betting you were high. The median five-year net margin ranged from a low of 1.06% of sales in 2011 to a high of 3.50% in 2009.3 Interestingly, there were very few reported operating losses in any given year; just very thin profit margins for almost all growers. Everyone is pretty much in the same boat earnings-wise: big and small, east, west, north and south. The vast majority ship to big boxes, but there isn’t a significant difference for those shipping to independents and other retail outlets. The range is surprisingly narrow from the best to the worst in any given year. This is especially true when we look at the median number, which removes the top and bottom performers.
Cash Flow Performance | Many people in this industry talk in terms of Earnings Before Interest, Taxes, Depreciation and Amortization (EBITDA) instead of net profits. Okay, let’s look at cash flow.
Median EBITDA is consistently less than 10% of sales. EBITDA divided by Current Portion of Long-Term Debt plus Interest is a key coverage ratio to determine ability to service term debt. In 2012, the ratio was 1.43x. That’s considered adequate and bankable, but we need to focus on cash generation, not ratios. You need to produce enough cash to meet current obligations, support future term debt borrowing capacity and to build working capital to provide a cushion for bad times or to take advantage of opportunities.
While financial ratios can be an over-simplification and can be misleading as a management tool, even discussions on cash can be misunderstood and incomplete. Net earnings, and even EBITDA, still don’t account for how much cash is left over after running your operation to fund managerial decisions, such as capital expenditures (capex) and dividends. Don’t be misled by the “earnings illusions” of static cash flow measurements that don’t account for cash that has already been absorbed by your operation. Focus on your cash needs and how much of it remains in your operation. The following two metrics show us how the industry is doing in this regard.
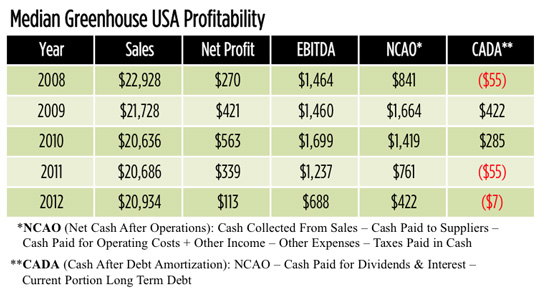
Net Cash After Operations (NCAO) considers cash flow after investment in, or divestment of, inventories and accounts receivable. The compiled data reveals the cash earnings generated are largely plowed back into increasingly higher levels of inventory to support higher sales goals. For some operations, the amount of the inventory increase in some years actually exceeded the profit margin. In other words, the cash from your profits was already gone and invested into higher inventory levels. The median greenhouse had cash after operations of $761,000 and $422,000 in 2011 and 2012, respectively. Is that enough cash considering the median greenhouse had sales of $21 million? That amount of cash left over was needed to replace worn-out fixed assets, repay term debt and pay dividends to the owner.
Cash After Debt Amortization (CADA) takes NCAO one step further. It’s the amount of cash left over after servicing your long-term debt obligations. For three of the five years in the study, CADA was negative. It was $(55,000) in 2011 and $(7,000) in 2012. This means in order to pay for non-financed capex, Median Greenhouse USA had one of three choices: Draw more on their line of credit; inject cash from outside the business; or ride their account payable float even harder (forget about taking advantage of trade discounts). The data shows that Median Greenhouse USA went with option #1: Higher draws on the line of credit. Capital expenditures, term debt servicing and dividend payments are after-tax uses of cash and shouldn’t be funded by your short-term line of credit.
Balance sheet implications
Repeated thin margins and the related cash deficiencies they create take a toll on your balance sheet. Deficit spending results in more debt and all of the issues that go along with it. Here are the implications of thin margins on the balance sheet:
Liquidity | Continued anemic earnings have resulted in the industry not having enough working capital. It’s not yet a chronic problem, but it’s going in the wrong direction. In 2012, working capital for Median Greenhouse USA was $1,255,000—its lowest point in four years. At the same time, sales showed a slight decrease. Fewer operations had the ability to take advantage of trade discounts, putting even more pressure on profit margins. Inventory grew as operators tried to support future sales growth. Creditors, banks and trade suppliers had to finance 100% of this increase. That’s okay for a while—as long as you can generate a profit, retain the cash and begin replenishing your working capital. If there’s a lack of replenishment of working capital, or if it occurs too slowly, it could create a problem with your banker.
Solvency | Compressed earnings require more borrowed capital as you increase your inventories and accounts receivable, replace worn-out fixed assets and repay term debt. Banks in general aren’t comfortable owning more of your business than you do for extended periods. Banks are agreeable to loan money for expansions and other uses as long as there’s a reasonable source of repayment. Again, it’s just as important to note the direction of the debt-to-worth ratio, as it’s the actual number at a given point in time. Surprisingly, and encouragingly, the solvency ratios have improved for the greenhouse industry in the past four years. For the most part, operators, given the fragile economy, have been reluctant to invest in expansions and have instead paid down long-term debt. The debt-to-worth ratio improved from 2.39:1 in 2008 to 1.65:1 in 2011. It increased slightly to 1.80:1 in 2012 as investment in fixed assets increased, but it speaks well of the cautious approach greenhouse growers charted during the recession.
In the future, you’ll encounter other factors that may compress your net profits. These will include: rising cost of Health Care; interest rates sure to rise from historic lows; inflationary pressures; another cold, rainy spring; and other impediments to profitable operations that we haven’t yet contemplated.
Dos and Don’ts
Now, while your balance sheet is in relatively good shape, do what you can to improve earnings. Don’t stretch to take on new business. Take it on because you can do so profitably, not because you’re afraid you’ll never be offered the territory again. Don’t offer new point-of-sale services without carefully analyzing whether you can do so profitably. Be extremely careful with your grow plan. You can’t afford poor sell-throughs, non-marketable plants taking up precious store shelf space, invoice credits or inventory dumps at either the farm or store level.
There are some “dos” to go along with the “don’ts.” Do have an honest talk with your customers. If your operation is not generating adequate cash to sustain long-term growth, tell them. Remember, most of your competitors are likewise concerned about generating more cash. Do talk to your banker or someone whose job it is to understand the financial requirements of your business. Have them detail the cash needs of your business. Lastly, remember that the first step of your annual budgeting process is to determine the cash needs of your business (that’s the minimum profit level you’re shooting for), project a plan to get there and then work the plan. Before you begin projecting revenue, costs and expenses, do set your goal by calculating the following cash needs for the coming year. I have inserted the cash needs and established an earnings goal for Median Greenhouse USA as follows:
Amount needed for non-financed capital expenditures $ 200,000
Amount needed to pay the principal on term-debt obligations $ 600,000
Amount needed to pay a dividend to the owner $ 100,000
Amounted needed to build working capital so all trade discounts are taken $ 200,000
Earnings Goal $1,100,000
Net Profit Margin 5.25%
You will note the profit margin is a healthy multiple of where Median Greenhouse USA has been for the past few years. By the way, the amount allocated to build working capital is generously spread out over three years. 4
Reason for optimism
I want to emphasize that the overall outlook for the industry is positive. Compared to the rest of the economy, it had a good four-year run during a very deep recession. However, the trajectory does not look good and needs to be reversed. As it stands now, the profit margins in a good year don’t compensate for the thin margins in most years and the occasional operating loss in a bad year.
I don’t have access to big box cost center accounting and cannot speak authoritatively on the profitability of their garden center operations. However, I know just enough about the retail environment to believe strongly that they’re profitable. That’s okay. We all want your customers to be strong and profitable. It’s great for the future of this industry that for every dollar spent on live goods, a multiple of that amount is spent on hard goods elsewhere in the store. Your plant material is probably the largest attachment category in the store. Hey, maybe you do have some leverage after all.
The big boxes, independent garden centers and other customers truly want to be constructive partners with their live good suppliers, but they have earnings goals as well. The problem up to this point is they haven’t understood the financial pressures you face. I hope this discussion will help them and your other customers to understand your challenges. The current compressed profit margin environment at the grower level isn’t good in the long-term for anyone in the live goods business.
GT
1 Data compiled by Barry Sturdivant, Bank of the West, and is available upon request.
2 USDA
3 Data compiled by Barry Sturdivant, Bank of the West, and is available upon request.
4 Example is for illustration purposes.
Barry Sturdivant is a Senior Vice President and Manager of the Nursery/Greenhouse AgriBusiness Center for Bank of the West. If you want to be part of this continuing database study and see how you compare, he may be reached at barry.sturdivant@bankofthewest.com or (951) 294.5234.
The opinions expressed in this article by Mr. Sturdivant are his own and do not necessarily reflect the views of Bank of the West.