4/25/2013
Conducting Onsite Greenhouse Trials
Paul Fisher, Rosanna Freyre & John Erwin
 1| Decide on the objective, or research question, for the experiment.
 What’s the problem you’re trying to solve? The objective should address a specific and important production question, be testable with an experiment, and the experimental outcomes should be measureable and answer the research question. For example, your objective might be: “To evaluate four root substrates—including our current peat/perlite mix—in terms of root growth, rooting percentage and shoot growth on petunia and nemesia when grown with our current mist irrigation
system.”
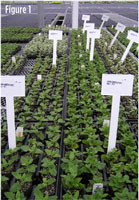
2| Locate the trial in an area in your greenhouse and/or outdoors that’s representative (light, temperature, watering) of the rest of the crop. Don’t use an area that’s only available space because it’s not good enough for normal production. Shading, temperature and edge effects affect trial results and reduce the validity of your conclusions/data. (See Figure 1.)
3| Choose plant material that’s healthy and representative of a typical crop (not junk plants that are unsalable, one that are a mix of leftover cultivars or are highly variable in size).
 4| Decide which factors and treatments you’ll test.
 One factor might be cultivar type and there might be two cultivars (treatment levels) within that factor, such as red or white geraniums. Another factor might be plant growth regulators (PGRs). One treatment for the PGR factor might be a chlormequat spray at 250 ppm, another treatment might be chlormequat at 500 ppm and a third treatment might be daminozide at 2,500 ppm. (See Table 1 for examples of a range in PGR concentrations to trial or do an Internet search for recommendations from extension agents, flower breeders and other growers.)
Table 1. Suggested plant growth regulator rates for trialing with herbaceous floricultural crops in the North and South. Be sure to follow EPA label restrictions, application volume and concentrations, and safety guidelines. Higher concentrations may be required than those listed above. As a starting range in a trial, include an untreated control group of plants for comparison, along with between 1 to 4 concentrations up to the maximum concentration in this table (for example, ethephon at 0, 200, 350, 500 and 650 ppm).
5| If you have two different factors (such as two cultivars and three PGR concentrations) consider doing all combinations of treatments within those factors. For example, red geraniums with each of the three PGR concentrations and white geraniums with each of the three PGR concentrations (making 2 x 3 = 6 combinations in total).
Don’t combine more than two factors at a time, however, or the numbers quickly get out of hand and results are hard to interpret. If you have more than two factors (for example: cultivar, chemical type, spray versus drench and four PGR concentrations), then break the trial into two or more separate experiments, each with its own clear objective.
6| Make sure you have a “control” (usually untreated) and/or a “standard” group (often what you normally do) of plants for comparison in the experiment. For chemical trials, consider whether the most appropriate control is untreated or treat with a clear water spray or drench—both types of control are sometimes useful. For example, if you want to trial a PGR drench, you might leave some pots un-drenched, drench some pots with water, and drench other pots with the PGR to ensure the effect is from the PGR and not an effect of moistening the root substrate.
If you have a “standard” treatment (for instance, your current peat/perlite mix when doing a root substrate comparison trial), it should also be included. If you’re evaluating fertilizer treatments, common sense means a “control” of no fertilizer through the entire growing period would not be an appropriate comparison, whereas your “standard” fertilizer practices would be more valid.
7| Treat a group of plants (several replicate plants) with each treatment level, rather than treating a single plant. Otherwise, you don’t know if growth differences arose because the one plant tested was unusually healthy or diseased, or differences were caused by the treatment itself. In general, the minimum number of plants (replicates) for any treatment should be 7 to 10 plants, pots or trays. Root growth tends to be more variable than shoot growth, so measure at least 10 individual plants when evaluating treatments such as rooting hormones. Measuring more than 15 plants per treatment is usually unnecessary. If counting plants within a tray as a replicate, be aware that one cutting or plug is not truly independent of other plants in the tray (so plants from multiple trays are more valid replicates). The more uniform the plants are at the start of the experiment, the easier it will be to see treatment effects, and the fewer the replicates that are needed.
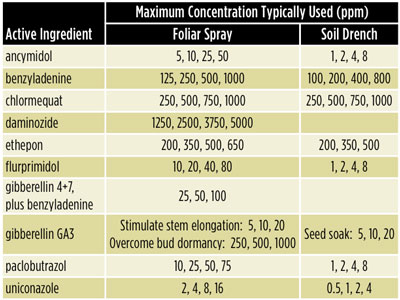
8| Even though you’ll probably only apply the treatments to a small group of plants, try to apply the treatments as closely as possible to how you would apply at a commercial scale. For example, with pesticides and growth regulator sprays, the dosage per plant or tray equals the concentration (ppm) times volume (liters or gallons). Therefore, figure out how much volume would be applied per large area with a commercial sprayer and scale this down to the small number of plants. For example, a spray at 1 gal. per 200 sq. ft. equals 19 ml (0.64 oz.) per sq. ft. or 30 ml (1 oz.) per 1020 tray (assuming actual size is 11 in. x 21 in.). Similarly, use your normal sprayer or at least try to use a pressurized sprayer that has a similar droplet size to the commercial sprayer. Battery-powered sprayers tend to have a more even pressure than pump sprayers. (See Figure 2.)
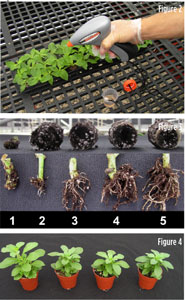
Figure 2. Take photographs of your experimental procedure. Preferably spray plants with the same chemical sprayer you use on crops, with the same pressure and volume. If you have to use a small sprayer, a battery-powered unit is preferred, and apply the same volume you would commercially spray per tray or pot.
Figure 3. For rooting or plant health measurements, it’s often best to have a simple 1 to 5 index with a photograph to help quickly evaluate plants.
Figure 4. Clear photographs of the results (in this case a liner dip with 0 [clear water], 1, 2, or 4 ppm of paclobutrazol applied to petunia) may be the most useful data you collect.
9| Use randomization to avoid bias. Ideally, plants should be randomly assigned to each treatment before applying treatments such as PGR sprays. Plants within treatments should be randomly distributed within the experimental area. At a minimum, mix the placing of treated plants on the bench. Alternatively, you can use the “=rand()” function in Excel to generate truly random numbers and sort each plant by the assigned random number.
1
0| Label every individual pot or tray to help you keep track of randomized pots. At the end of the experiment, line up the pots again in their treatment groups so that you can more clearly see trends. Don’t apply the treatments, move the plants and then later try to guess which pot received what treatment! Also, use special labels so the material is not sold by mistake.
11| Avoid confounding factors, which are any alternative or uncontrolled reasons that could affect results other than the experimental treatments. For example, if you’re doing different fungicide treatments to liners, then apply the treatments to the same cultivar of liners—not one cultivar for one fungicide and a different cultivar for another fungicide. Otherwise, you cannot tell why differences occur (in this case because of fungicide or cultivar).
12| Decide what data (measurements) will be collected. Choose data that will be important for your management decisions later on. For example, height, branching and flowering date are essential for PGR experiments. Try to come up with a number value for each observation so that you can be unbiased and objective. For example, number of flower buds per plant is straightforward. For plant health, consider an index, like photos of representative plants ranging from 1 (healthy) to 5 (dead). Printing out those photos and referring to them often will help avoid subjective “drift” as you collect data.
Avoid measuring large amounts of time-consuming data. There’s a trade-off between quantity and quality—think carefully about what data are essential to answer your research question. For example, for the root substrate objective in point (1) above, data collection would concentrate on measurements that relate to rooted cutting quality. You might want to have a rooting index, define a shippable liner so that you could estimate time to finish, measure shoot height and test weekly substrate-pH and electrical conductivity (EC). Be flexible—if after the trial starts you observe an unexpected effect (such as phytotoxicity), then photograph, take notes or measure that effect.
Consider how your treatments will affect your customer—a PGR may be great in plug production, but stalls for your finished plant customer. If applying treatments to young plants, transplant them and grow them out in the finished container. Evaluate landscape performance for treatments to potted plants. (See Figure 3.)
13| Try to run the trial as close as possible to the normal growing season. Include climate data (such as average air temperature and moles/m2/day) for most experiments. Simple max/min thermometers are useful tools for checking air temperature, as well as more sophisticated data loggers and environmental control computers. Look at climate tracking options from companies such as Spectrum Technologies or Apogee Instruments.
14| Set up an experimental calendar showing what needs to happen on each date over the coming weeks, including treatments and data collection. Take data and photos when they’re scheduled. Late data and pictures reduce the value of the experiment.
15| Take photos of representative plants. If plants are variable, show the best, average and worst plant per treatment. Document all activities in a logbook and set up one spreadsheet file for each experiment, documenting when plants arrive, when seed germinates, when treatments are started, environmental conditions when sprays are applied, etc. Modify your planned experimental calendar to include the actual dates of treatment application or data collection. Record all data for the experiment in the same spreadsheet file so you know where to find it. Put all photos and notes into the same computer folder. (See Figure 4.)
16| Choose a person who wants to do experiments to do experiments and is detail-oriented. The person must be assigned enough time to do a good job. Adding trialing responsibilities on top of a full-time job is rarely sustainable for ongoing R & D.
17| Don’t sell the plants before you collect data! Mark trays to clearly identify the experimental plants so they don’t get separated and/or sold. Spray painting the trays or otherwise making them unsalable can sometimes be the safest approach.
18| If you’re going to present the details to others in the company, decide whether graphs (spreadsheet), a
presentation (such as PowerPoint) or a report are needed. You aren’t writing a thesis, so only make this as detailed as is needed for your management team to make decisions.
GT
We thank leading allied and greenhouse businesses in the Floriculture Research Alliance (www.floriculturalliance.org) for support of our onsite projects. The use of trade names in this publication doesn’t imply endorsement of the products named or criticism of similar ones not mentioned. Our sponsor companies include:
A.M.A. Plastics
Agri-Starts
Altman Plants
Ball Horticultural Company
Blackmore Company
C. Raker & Sons
D.S. Cole Growers
Fafard et Frères/Heveco
Fides/Oro Farms
Four Star Greenhouses
Greencare Fertilizers, Inc.
Henry Mast Greenhouses
Knox Nursery
Kube-Pak Corp.
Lucas Greenhouses
Mast Young Plants
Metrolina Greenhouses
Philips Lighting
Pindstrup
Pleasant View Gardens
Premier Horticulture
Quality Analytical Labs
River Street Flowerland
Rockwell Farms
Smith Gardens
Smithers Oasis
Speedling
Spring Meadow Nursery
Sun Gro Horticulture
Syngenta
Wagner Greenhouses
Welby Gardens
Paul Fisher is Associate Professor and Extension Specialist in the Environmental Horticulture Department and Rosanna Freyre is Assistance Research Professor for the University of Florida. John Erwin is Professor of Greenhouse Crop and Floriculture Physiology and Extension at the University of Minnesota.