12/27/2012
U.S. Exports/Imports of Ornamental Plants Between 1992 & 2011
Mark Wocial
As part of export and import compliance, all U.S. companies involved in international trade are required to provide product information according to Schedule B and the Harmonized Tariff Schedule (HTS) of the United States. When exporting products from the United States, the system of classification is called Schedule B and is managed by the U.S. Census Bureau Foreign Trade Division. When importing products into the U.S., the system of classification is called HTS and is managed by the Office of Tariff Affairs and Trade Agreements. Both Schedule B and HTS are divided into chapters, headings, subheadings and commodity codes.
Ornamental crops fall primarily into Chapter 6 of the Schedule B and HTS. Chapter 6 is described as follows: “Live trees, plants, bulbs, roots and the like; cut flowers and ornamental foliage.” Ornamental plant seeds fall into Chapter 12 under the heading 1209 described as “seeds, fruit and spores used for sowing.” Depending on the economic importance of specific products, a specific commodity code is assigned or they fall into all-inclusive categories.
There are differences in this respect between exports and imports. Export information collected by the Census Bureau is primarily for statistical purposes, while import information is for both statistical information and import tariff collection. Therefore, import commodity codes tend to be more specific. For example, all flower bulbs exported from the U.S. are classified under one Schedule B number, while HTS numbers distinguish between many different types of bulbs imported into the U.S., like tulips, hyacinth, lily and crocus.
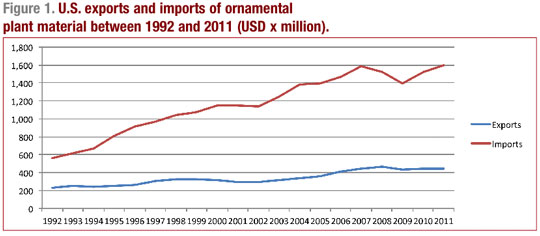
In 2011, U.S. companies imported $1.6 billion and exported $0.45 billion worth of ornamental plant seeds, cuttings, bulbs, plants, cut flowers and foliage.
In the last two decades, imports have been growing much faster than exports. In 1992, exports accounted for 29% of international trade in ornamental plant material, while imports accounted for 71%. Between 1992 and 2011, exports grew at an average annual rate of 3.6% and imports grew at an average annual rate of 5.7%. As a result, exports doubled during that period while imports tripled. In 2011, the export share of international trade decreased to 22% while the import share increased to 78%. (Figure 1)
U.S. exports by country
Canada is the largest export market for U.S. ornamental plant material, followed by the Netherlands. In 2011, U.S. companies exported $233.8 million worth of ornamental plant material to Canada, which represented 52.2% of all ornamental horticulture exports. Exports to the Netherlands were valued at $70.3 million and accounted for 15.7% of exports. Thus, exports to these two countries represent 67.8% of all exports of ornamental plant material. Belgium is the third largest market, followed by Mexico, Japan, Germany, China, the Bahamas, Colombia and Spain. The top 10 markets account for 87.6% of all ornamental plant exports.
In 2011, fresh foliage represented 91% of exports to Belgium, and miscellaneous plants and rooted cuttings accounted for 72% of exports to the Bahamas. Trade data show drastic differences in exports to the NAFTA (North America Free Trade Agreement) countries, Canada and Mexico. NAFTA agreement became law in January 1994. Since then, U.S. exports of ornamental plant material to Canada have been growing at an average annual rate of 4.3%. Exports to Mexico have remained mostly unchanged at around $18 million.
China is still a relatively small market for U.S. exports of ornamental plant material. In 2011, exports to China were valued at $8.9 million; however, they’ve been growing at an average annual rate of 13.4% since 1992.
U.S. exports by product category
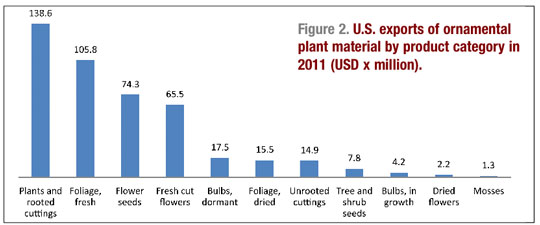
In 2011, U.S. exports of ornamental plant material were valued at $447 million. Plants and rooted cuttings are the largest export category representing 31% of all exports. In 2011, exports of products in this category amounted to $138.6 million. After a long period of little growth, exports of plants and rooted cuttings increased from $80.6 million in 2001 to a peak of $149 million in 2006. Exports declined slightly in the following years. (Figure 2)
U.S. exports of flower seeds
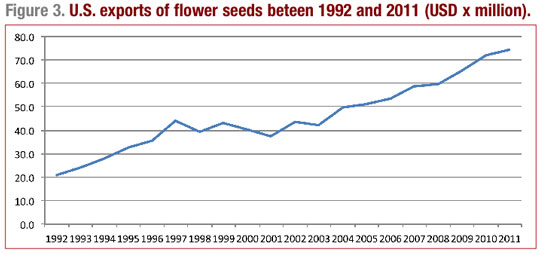
Flower seeds are the third largest category of export products representing 16.6% of all exports. Exports of flower seeds grew steadily from $37.5 million in 2001 to $74.3 million in 2011. Export commodity codes in Schedule B distinguish only petunia and pansy seeds as separate commodities. All other flower seeds are reported under one product code as “seeds of herbaceous flowering plants.” Exports of petunia seeds declined significantly between 2007 and 2011 while exports of pansy seeds showed an opposite trend. However, these two products accounted for just 1% of seed exports in 2011. Exports of all other flower seeds grew at an annual rate of 6.7% between 2007 and 2011. (Figure 3)
The Netherlands and Canada are the two largest markets for U.S. flower seeds. In 2011, exports to the Netherlands were valued at $16.2 million and exports to Canada at $13.2. These two markets accounted for 40% of all U.S. seed exports. Germany, Japan, United Kingdom, China, France, South Korea, Australia and Hong Kong were the remaining top 10 export markets. U.S. flower seed exports to China started in 1998 and have been growing at an average annual rate of 30.3%, reaching a value of $4 million in 2011.
U.S. exports of cut flowers
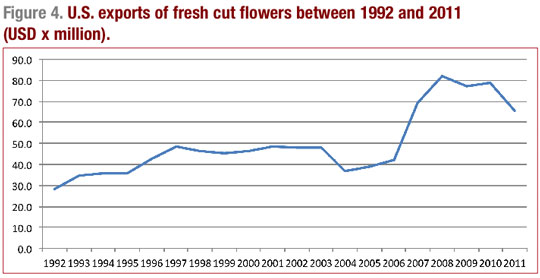
Cut flowers are the fourth largest category of export products, representing 14.6% of all exports. After a long period of flat or declining sales, U.S. exports of fresh cut flowers doubled from $36.7 million in 2004 to $82.0 million in 2008. Exports showed a declining trend in the subsequent years and dropped to $65.5 million in 2011. (Figure 4)
In 2011, roses accounted for 38% of all cut flower exports. Rose exports grew at an average annual rate of 3.5% between 2007 and 2011. Carnations accounted for 12% of cut flower exports, but the value of exports was declining by 4.5% per year in the same period. Chrysanthemums represented 8% of cut flower exports, growing at 12.6% annually between 2007 and 2011. In 2011, cut orchids represented only 3% of cut flower exports, but the value of exports grew at an average annual rate of 67.5% between 2007 and 2011. Exports of all other cut flowers were valued at $25.2 million in 2011 and their exports were declining by 7.3% annually between 2007 and 2011.
U.S. imports by country
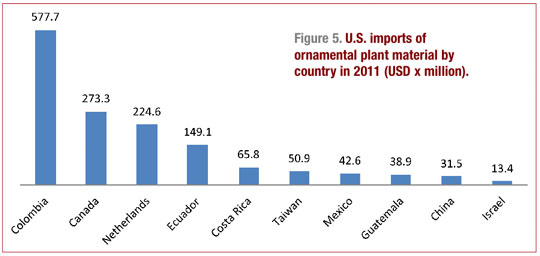
Colombia, Canada, the Netherlands and Ecuador are the largest suppliers of ornamental plant material into the U.S. and together represent 76.6% of all U.S. imports of ornamental plant material. In 2011, imports from Colombia were valued at $577.7 million, Canada at $273.3 million, the Netherlands at $224.6 million and Ecuador at $149.1 million. The remaining top 10 import countries included Costa Rica, Taiwan, Mexico, Guatemala, China and Israel. In 2011, the top 10 countries accounted for 91.8% of all U.S. imports of ornamental plant material.
Almost all imports from Colombia (97%) and Ecuador (98%) are in the form of fresh cut flowers. Two major product categories imported from the Netherlands are flower bulbs (61%) and cut flowers (20%). Unrooted cuttings are a major product category imported from Guatemala, Costa Rica and Mexico. Orchid plants represent 97% of imports from Taiwan. (Figure 5)
U.S. imports by product category
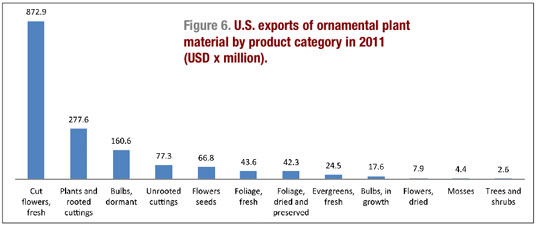
In 2011, U.S. imports of ornamental plant material amounted to $1.6 billion. Cut flowers are the single largest product category dominating U.S. imports. In 2011, imports of cut flowers represented 54.6% of all imports and were valued at $873 million. Imports of plants and rooted cuttings accounted for 17.4% of all imports and amounted to $278 million. In 2011, imports of bulbs were valued at $160 million and accounted for 10.4% of imports. Together, these three product groups accounted for 82% of all imports. (Figure 6 )
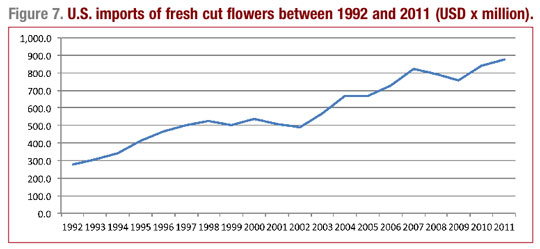
U.S. imports of cut flowers have been growing steadily since 1992. The fastest growth in imports occurred in the period from 2002 to 2007. Between 2007 and 2011, import growth slowed down to just 1.5% per year. In 2011, imports of cut flowers into the U.S. were valued at $873 million. (Figure 7)
In 2011, imports of roses accounted for 42% of cut flower imports (standard, spray and sweetheart) and were valued at $365.4 million. Pom-pom chrysanthemums were the second-largest product category accounting for 10% of imports, valued at $85 million. Alstroemeria accounted for 6% of imports, valued at $53.9 million. Between 2007 and 2011, non-pom-pom chrysanthemums were the fastest-growing import category, increasing at an average annual rate of 31.8%. Snapdragons were the second fastest-growing cut flower import, increasing at 31.3% annually.
Imports of cut orchids increased from $11.1 million in 2007 to $13.6 million in 2011. Imports of dendrobium-type orchids grew at a faster annual rate (9.2%) than imports of other orchid types (2.3%).
Most cut flowers are imported into the U.S. from Colombia, which accounts for 63.8% of all cut flower imports. In 2011, imports from Colombia were valued at $562.2 million. Ecuador is the second largest supplier of cut flowers into the U.S, with an import market share of 16.7%. Imports from Ecuador were valued at $146.7 million in 2011.
U.S. imports of plants and rooted cuttings
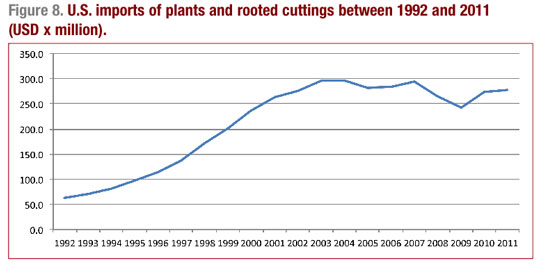
Plants and rooted cuttings are the second-largest category of import products, representing 17.4% of all imports. Imports of plants and rooted cuttings grew at an average annual rate of 15% between 1992 and 2003, when imports reached their peak at $296.5 million. Imports fluctuated between 2003 and 2011 when they were valued at $277.5 million. (Figure 8)
In 2011, orchids were the single largest product group among plant imports at the commodity level captured by the trade statistics. They were valued at $69.4 million and represented 25% of imports in this category. Between 2007 and 2011, imports of orchid plants grew at an average annual rate of 14.5%. Imports of trees/shrubs and herbaceous perennials were valued at over $23 million each. Each of these product groups accounted for about 8% of plant imports. Imports of both groups declined between 2007 and 2011. The all-inclusive category of plants was valued at $130.9 million in 2011.
U.S. imports of flower bulbs
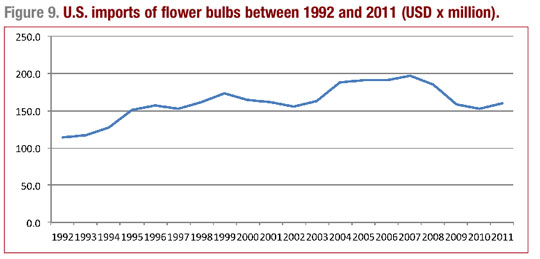
Flower bulbs are the third largest category representing 10% of imported ornamental plant material. In the last two decades, U.S. imports of flower bulbs fluctuated between $150 and $200 million. In recent years, imports have been declining since 2007. In 2011, bulb imports were valued at $160.6 million. Between 2007 and 2011, bulb imports declined by an average rate of 5% per year. All bulb species experienced declines in imports with the largest declines in gladiolus, begonia and iris. Imports of gladiolus corms declined by almost 19%, begonia tubers by 11.1% and iris bulbs by 10.3% per year. (Figure 9)
U.S. imports of unrooted cuttings
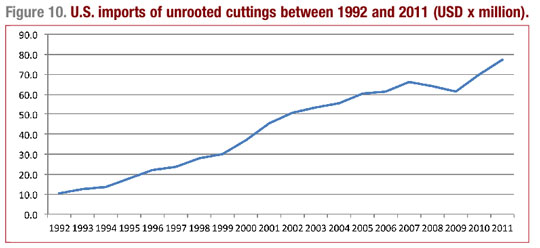
Unrooted cuttings are the fourth-largest product category representing 4.8% of imported plant material. Imports of unrooted cuttings grew at average annual rate of 11.3% between 1992 and 2011. The value of imports increased from $10.3 million in 1992 to $77.3 million in 2011. More than half of all unrooted cuttings are imported from Costa Rica and Guatemala. In 2011, the value of cuttings imported from Costa Rica reached $25.9 million and accounted for 33.5% of all cutting imports. Cuttings imported from Guatemala were valued at $16.2 million and represented 21% of all imported cuttings. Mexico is the third-largest supplier of unrooted cuttings. In 2011, imports from Mexico reached $10.5 million and represented 13.5% of all imports. Among top 10 countries, unrooted cuttings are also imported from El Salvador, China, Israel, Colombia, Dominican Republic, Brazil and Ethiopia. The top 10 countries represent 92% of all imports of unrooted cuttings. (Figure 10)
Conclusions
Analysis of the international trade statistics collected by the U.S. Census Bureau Foreign Trade Division reflects a growing trade deficit in ornamental plant material. The U.S. trade deficit increased from $328.3 million in 1992 to $1.2 billion in 2011. Canada is the largest export market representing more than 52% of U.S. exports. U.S. exports to Mexico have not increased since the introduction of the NAFTA agreement in 1994, while imports from Mexico have been growing at an average annual rate of 3.7%. Only four European countries are among top U.S. export destinations: the Netherlands, Belgium, Germany and Spain that together account for 24% of U.S. exports. China has become the seventh largest market for U.S. products but also the ninth largest supplier of ornamental plant material into the U.S.
Can the U.S. ornamental horticulture industry improve its international trade record and decrease trade deficit? In 2010, the U.S. government announced a comprehensive strategy called the National Export Initiative (NEI) with the objective to double American exports by 2015. The NEI is focused on helping U.S. firms, especially small and medium-size businesses, overcome the hurdles to entering new export markets, by assisting with product promotion, participation in trade missions, finding overseas distributors and financing international trade. A variety of export assistance programs are available, such as the Branded Program, which provides 50% cost reimbursement for a variety of eligible international marketing activities. They include fees for exhibitions at international trade shows, advertising, promotional publications, translations, freight cost for samples and more. A variety of export assistance resources and programs are available from the USDA Foreign Agricultural Service and Export Assistance centers in each state.
Considering that just one country, Canada, accounts for more than half of U.S. exports and just 10 countries account for almost 90% of U.S. exports, it can be argued that there are opportunities around the world to increase U.S. exports of ornamental plant material. A detailed analysis of the existing trade data can give insights into global opportunities. This article was designed as an overview of the U.S. international trade data. Much more detailed export and import information for each country, including quantities and prices, is also available.
GT
Note: The information presented in this article is based on the analysis of international trade data collected by the U.S. Census Bureau.
Mark Wocial is a Certified Global Business Professional specializing in the horticulture industry. He is a member of NASBITE, National Association of Small Business International Trade Educators (www.nasbite.org). He can be reached by email at wocial-associates@att.net.