2/1/2024
Benchmarking Your Production & Sales
Dr. Marvin Miller
For the last two years, the U.S. Department of Agriculture’s National Agricultural Statistics Service (USDA/NASS) Floriculture Crops Summary has reported on growers’ production and sales across all 50 states. Growers with at least $10,000 in wholesale sales (farm gate, i.e., at the greenhouse door) were asked to report, and growers with at least $100,000 in sales were asked to report the crop-by-crop statistics of their firms’ production and sales. With this information, the report offers the chance for firms to compare their production and sales to the national data with a critical eye.
Asking why your firm’s sales focus might be more concentrated or less concentrated than the national averages for any crop can be a great learning opportunity when planning your firm’s growth. Perhaps you sell more or less than the average grower; this is perfectly fine if you can justify your differences because of marketplace conditions or areas of specialization.
By assuming what gets produced and sold by growers ends up at retail, retailers, too, might learn of opportunities to alter their mix of floricultural products to better hone their inventories towards the marketplace. The real possibility is that, with some introspection, you might gain a greater understanding of the market as a whole and thereby learn more of what makes your business unique and why.
The overall floriculture market in the U.S.
The most recent gauge of the U.S. floriculture market is offered by the Floriculture Crops: 2022 Summary, which was released in May 2023. This report tallied $6.685 billion in domestically produced floriculture sales. This was an increase of 4.2% over the 2021 sales level of $6.415 billion.
Examining the $6.448 billion in sales of growers with at least $100,000 in sales offers the opportunity to gain a closer look at the industry segments. To begin this analysis, we know that $514.4 million were sales of plant propagative materials (e.g., plugs, cuttings, liners, tissue cultured plantlets and prefinished plants). Subtracting these sales, since these products are used as inputs by other growers to finish their production, yields a total of $5.934 billion in finished (market-ready) floricultural sales, enabling an analysis by industry segments (Figure 1). The total finished floriculture sales in 2022 were up 4.9% from the $5.672 billion recorded for 2021.
Bedding/Garden Plants
About 60% of total 2022 finished floriculture sales in the U.S. are related to the bedding/garden plant market. This includes sales of flats and packs, as well as sales of potted garden plants and hanging baskets aimed for outdoor use, primarily in the garden or on decks, patios, front stoops and the like. Of this total, about 69% of sales are annual flowering, vegetable or herb plants, and about 31% are perennials. Vegetables account for almost 9.8% of total annual plant sales and herbs account for an additional 3.4% of annual plant sales.
 How do these percentages compare to your firm’s sales? In 2022, USDA reported the bedding/garden plant market was valued at $3.56 billion, which compared with $3.40 billion in 2021, an increase of 4.65%.
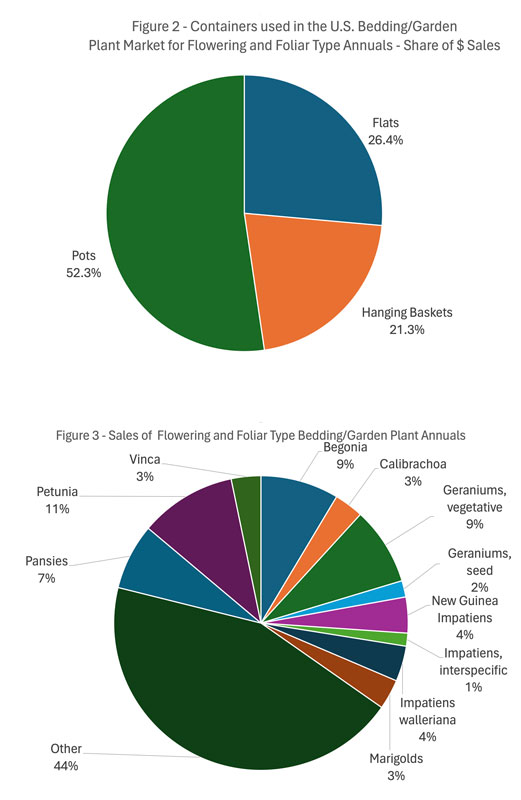
By far, the largest part of the bedding/garden plant market is the flowering and foliar type plants, which account for $2.142 billion in sales. These are dominated by plants produced and sold in pots (52.3% of the sales dollars), followed by those sold in flats (26.4%), and those sold in hanging baskets (21.3%) (Figure 2).
The largest individually identified class among all flowering and foliar types across all container types in sales dollars is petunias (10.6% of all flowering and foliar type bedding/garden plant dollars), which are followed by begonias (8.6%), vegetatively propagated geraniums[1] (8.6%), pansies/violas (7.2%), New Guinea impatiens[2] (3.9%), Impatiens walleriana (3.9%), marigolds (3.3%), vinca[3] (3.3%), calibrachoa (3.2%), seed-propagated geraniums[2] (1.8%), and interspecific impatiens[3] (1.4%). All other classes accounted for 44.2% of the flowering and foliar type bedding/garden plants sales dollars (Figure 3). For all individually identified classes, the dominant container type is the pot, except for Impatiens walleriana, marigolds and pansies/violas, where sales in flats dominate.
In terms of importance of the various flowering annuals between 2021 and 2022, begonias (+28.0%), calibrachoa (+32.3%), seed geraniums (+11.5%), New Guinea impatiens (+4.9%), interspecific impatiens (+3.6%), vinca (+31.4%), and other varieties (+2.1%) all saw revenue dollars increase, while vegetative geraniums (-2.1%), Impatiens walleriana (-5.5%), marigolds (-4.6%), pansies (-0.9%), and petunias (-2.9%) saw revenue dollars decrease. Total flowering bedding/garden plant dollars were up 4.0% from 2021 to 2022. Among edibles, tomatoes (+6.2%), peppers (+7.0%) and herbs (+15.1%) saw increased revenue dollars, while other vegetable types (-3.1%) saw revenue dollars decrease. Total edible sales revenues were up 4.9% between 2021 and 2022.
[1] If seed- and vegetatively-propagated geraniums are considered collectively (10.4% of the flowering and foliar type bedding/garden plant dollars), they would still be surpassed by the petunia dollars (10.6%).
[2] Based on other information, this author believes that interspecific impatiens have probably moved ahead of traditional New Guinea impatiens in the market and that grower respondents and/or the bookkeepers filling out the survey forms may not have a clear view of the difference between these two classes. The text and chart are reflecting what data were reported.
[3] Catharanthus roseus
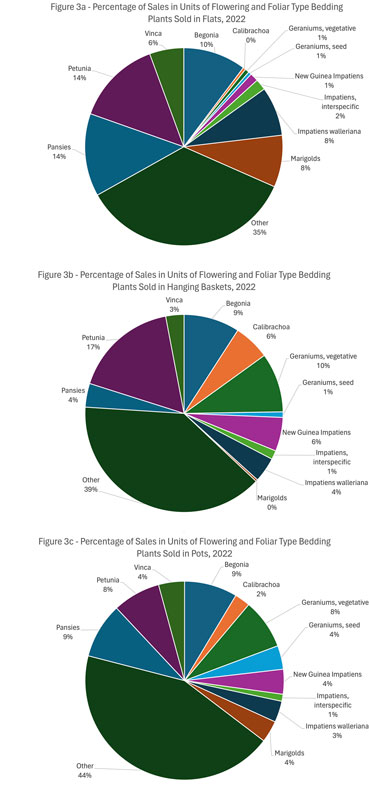 When it comes to unit sales of flowering and foliar type bedding/garden plants, a lot depends on the class being considered, the containers used and the geography of the production or retailer. Still, a lot can be learned by looking at the national rankings across the three container types.
For example, petunias are the top class in flats and in hanging baskets, but rank fourth in potted flowering and foliar types grown in pots. Yet, begonias rank #2 or #3 across all container types—flats, hanging baskets and pots—even though the same begonia species may not dominate across the container types. Figures 3a, 3b and 3c show the unit sales in percentages of the separately identified flowering and foliar type bedding plants in flats, in hanging baskets and in pots, respectively, for 2022.
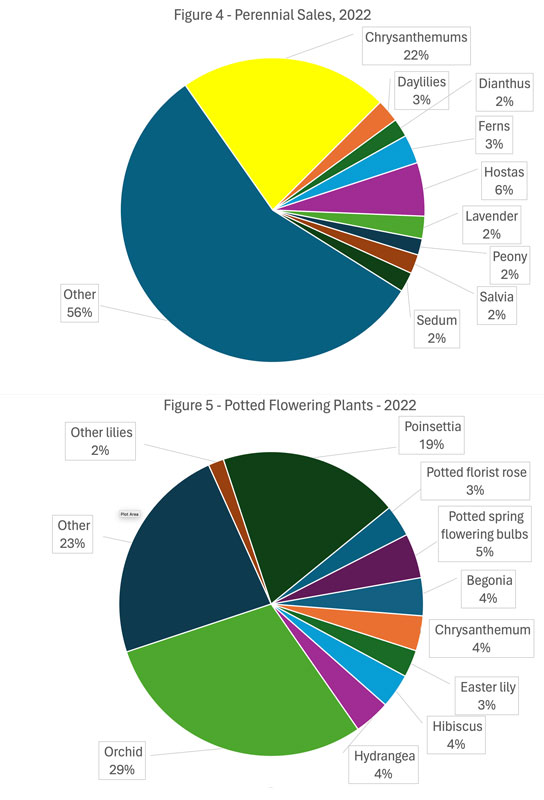
As previously mentioned, perennials, which accounted for $1.093 billion in 2022 sales and which were up 5.9% over the 2021 total, represented 31% of the total bedding/garden plant sales dollars. Of the individually identified classes, chrysanthemums was by far the largest, representing 22.2% of the perennial dollars (Figure 4). Hostas (5.7% of the perennial dollars), ferns (3.1%), daylilies (2.4%), lavender (2.4%), sedum (2.1%), salvia (2.0%), dianthus (2.0%) and peony (1.7%) were other individually identified classes, while other classes (56.4%) represented the remainder of the perennial sales dollars. In terms of importance of the various perennials between 2021 and 2022, chrysanthemums (+7.4%), dianthus (+12.1%), ferns (+16.7%), lavender (+22.6%), peonies (+10.8%), salvia (+19.5%), sedum (+16.5%) and other varieties (+4.5%) all saw revenue dollars increase, while daylilies (-7.9%) and hostas (-1.6%) saw revenue declines.
Potted Flowering Plants
The second largest floriculture industry segment in the U.S. market is potted flowering plants for indoor or patio use. This segment accounted for $1.11 billion dollars in sales in 2022, up from $1.03 billion in 2021, and rose in importance to 18.8% of the finished floriculture sales pie in 2022, up from 18.2% in 2021. Potted orchids (29.6% of the segment’s dollars) and poinsettias (19.2%) were the top two plant classes separately identified (Figure 5), followed by potted spring bulbs (4.7%), begonias (4.0%), hydrangeas (3.8%), florist chrysanthemums (3.7%), hibiscus (3.6%), potted florist roses (3.4%), Easter lilies (2.9%), and other lilies (1.7%). Other varieties accounted for 23.4% of the segment’s dollars.
The importance of various potted flowering plants fluctuated widely between 2021 and 2022, ranging from increases in revenues of over 135% to decreases of over 10%. Revenues changed as follows: hydrangea (+135.7%), begonias (+108.0%), chrysanthemums (+24.2%), other lilies (+18.4%), potted florist roses (+13.2%), orchids (+7.7%), hibiscus (+0.9%), poinsettias (-0.4%), Easter lilies (-4.2%), potted spring flowering bulbs (-10.4%), and other varieties (+1.4%).
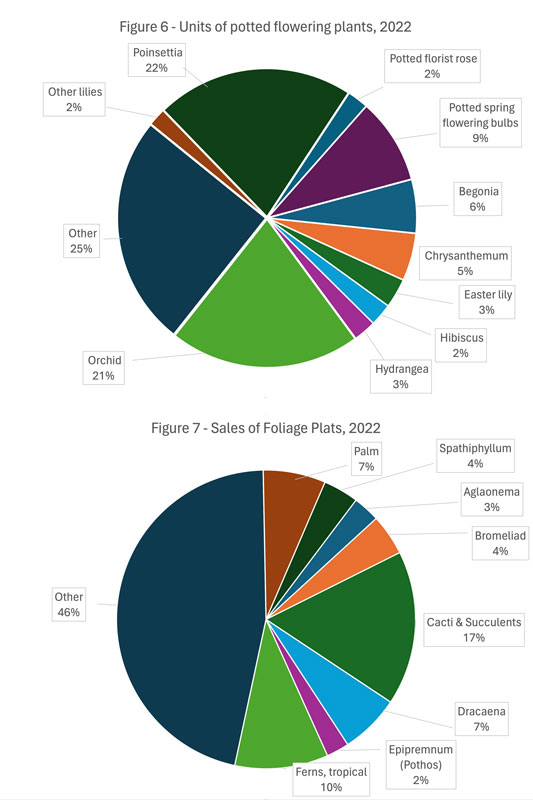
Potted flowering plant sales, in terms of units, were dominated by poinsettias (21.5%), orchids (20.8%), and potted spring bulbs (9.3%), which collectively accounted for over half of the units sold in 2022 (Figure 6). Other separately identified classes included begonias (5.8% of units), chrysanthemums (5.2%), Easter lilies (3.2%), hydrangeas (2.5%), hibiscus (2.4%), florist roses (2.3%) and other lilies (1.9%). Other varieties accounted for 25.2% of the units sold in 2022.
Foliage Plants
The third industry segment of importance for U.S. floriculture is foliage plants, accounting for 13.9% of sales dollars in 2022, up from 13.4% of industry sales in 2021. Total sales increased in 2022 to $826.3 million (up 8.9%). Over 91% of the segment’s dollars came from sales of potted foliage plants, while nearly 9% came from sales of foliage hanging baskets.
Of the separately-identified classes sold in 2022, cacti and succulents accounted for 16.7% of sales (Figure 7), and tropical ferns accounted for 10.1% of sales. These were followed by palms (6.8 % of sales), dracaena (6.5%), bromeliads (4.4%), spathiphyllum (3.8%), aglaonema (2.9%), and epipremnum (pothos) (2.5%). All other classes accounted for the remaining 46.3% of foliage sales.
Cut Flowers
U.S. sales of domestically produced cut flowers dropped to $333.1 million in 2022, down 6.8% from the $357.4 million in 2021 sales. Cut flowers accounted for only 5.6% of the finished floriculture sales pie in 2022, down from 6.3% of the 2021 pie. Estimates are that at least 80% of the cut flowers used in the U.S. are imported.
There are 17 separately identified classes of cut flowers reported in the USDA data. Tulips accounted for 19.9% of the 2022 sales revenues, while lilies contributed another 16.9% of sales. Next in importance were gerbera daisies (5.7% of 2022 sales), gladioli (4.8%), roses (4.1%), peonies (3.9%), sunflowers (2.7%), orchids (2.6%) and iris (2.0%). Asters, dahlias, snapdragons, waxflowers and chrysanthemums each contributed between 1% and 2% of 2022 sales, while lisianthus, delphinium and protea each contributed less than 1% of total sales. Other varieties accounted for 27.4% of the segment’s sales in 2022.
There’s strong reason to believe that many of the growers falling below the $100,000 threshold for completing the entire crop-by-crop detail of the questionnaire are also cut flower growers. There may even be many cut flower producers who fall below the $10,000 threshold for inclusion in the survey. In particular, in recent years there’s been a surge in demand for locally produced cut flowers, and there are many part-time producers focusing efforts on supplying farmers’ markets, a single wholesale florist or just a few retailers.
Cut Cultivated Greens
The final sliver of the floriculture production pie is for cut cultivated greens, and these accounted for $101.3 million or just 1.7% of 2022 sales. Sales were off from the 2021 level of $105.4 million, which accounted for 1.9% of the 2021 pie. Leatherleaf fern dominated the separately-identified classes here, accounting for 34.3% of 2022 sales, followed by eucalyptus (9.0%), pittosporum (7.1%), asparagus/tree ferns (4.0%) and aspidistra (1.8%). Other varieties of cut cultivated greens accounted for the remaining 43.7% of 2022 sales revenues.
Final thoughts
Though down from the incredible growth rates experienced during the COVID-19 pandemic, the growth rate of 4%+ in overall sales, at first glance, appears quite healthy. However, if inflation is considered, real sales for most growers were probably off. The challenges of increased labor, energy and other input costs likely devoured most of the increases in sales.
One of the challenges facing the U.S. floriculture industry is succession planning. Many operators don’t have heirs apparent for their businesses, or the current and/or next generations aren’t interested in seeing the business continue. Indeed, the 2022 survey recorded 594 fewer operations. Of those firms with $100,000 in sales or more, there were 130 fewer firms responding.
Possibly the largest challenge facing the U.S. floriculture market is finding labor. Firms sometimes seem to be in a bidding war to hire head growers and salaries for these team leaders can easily run into six figures for medium to large operations. The challenges of finding enough workers to complement the staff has led many firms to adopt using immigrant guest workers in recent years and this has driven basic pay levels skyward. Still, many firms are operating at below capacity, simply because they cannot find enough labor.
The other challenge many are experiencing is understanding the consumers’ desires. What seems popular one year may not be on the consumer’s radar a year later. Double-digit swings in demand, as evidenced in the statistics, seem more common than in the past. Of course, this is great when demand exceeds supply, but it can be devasting when the reverse is true. This is why an annual review of your firm’s production and sales is not only important, but essential. And if you’re so inclined, the USDA provides similar data on a state-by-state basis for the top 28 states. If you’re in one of the 22 “other states” not separately identified, perhaps a nearby state or group of states can serve as a proxy for regional trends.
What becomes important for firms in such challenging times is to be true to one’s value proposition, i.e., know why you’re in business and know what makes your business unique. Comparing and contrasting your firm’s production and sales with the national averages is one way to show your uniqueness, which might be worth bragging about, especially if it’s profitable and it helps explain your market niche.
It’s also very important to communicate your value proposition not only within your firm to all levels of employees, but to customers, and in some cases, to those farther down the market channel as well. People like to patronize firms with a unique story, which are producing goods and services that also have stories behind them. Communicating these stories is always important, but it becomes even more critical when the consumer is debating whether to spend or where to spend their monies.
Dr. Marvin N. Miller is market research manager for Ball Horticultural Company in West Chicago, Illinois.