6/1/2018
Afraid of Your Shadows?
A.J. Both & Tim Shelford
Sunlight literally powers the world and is typically the main energy source that drives photosynthesis. It’s easy to forget that life on Earth would be impossible without sunlight.
Plants have evolved to convert sunlight into biomass, but the conversion process is relatively inefficient. Only a few percent of the energy contained in sunlight is converted into plant growth; the rest is reflected, transmitted or converted into heat.
Physicists sometimes define light (radiation) as matter (consisting of very small particles or photons) and other times as waves (like the waves on a water surface). When we want to know the color of light emitted by a particular source, we use the wave definition and associate a particular color with its wavelength. When we want to measure the light intensity, we use the particle definition and measure the number of photons that are received at a particular location or surface over a specific period of time.
For wavelength, we use the units of nanometer (nm; one billionth of a meter), and for the number of photons, we the Avogadro constant to quantify the light intensity.
The solar intensity typically ranges between 0 and 2,000 μmol•m-2•s-1. Sometimes it’s convenient to accumulate the light intensity over a specific time period (e.g., a single day), and in that case, we express the total amount of light received in the units of mol•m-2•d-1 (typical values range between 0 and 65 for most locations across the United States). Figure 1 shows the accumulated
(or integrated) light levels for Geneva, New York, for every day over an 11-year period.
Solar spectrum
Sunlight consists of three distinct wavebands of radiation: ultraviolet (UV), visible light and infrared. Each of these wavebands can be defined by specific wavelength intervals: UV = 280-380 nm, visible light = 380-780 nm and infrared = 780-3,000 nm.
UV radiation is often harmful to biological tissue (e.g., it causes sunburn), but some plants can benefit from specific amounts of UV (e.g., it stimulates the production of anthocyanin in red lettuce).
Visible light consists of all the colors in the rainbow (e.g., 450 nm light is considered blue and 660 nm is considered red; for convenience, the familiar colors of light are associated with different ranges of wavelengths or wavebands).
Infrared, or heat radiation, can increase the surface temperature of any object that receives it and the amount of infrared radiation we receive from the sun is largely due to the high surface temperature of the sun, despite the long distance between the sun and earth.
Measuring the spectrum of light emitted by any source requires the use of a spectroradiometer, an instrument that can determine the radiation (light) output at every wavelength across a specific waveband. The resulting spectral graphs provide insight into the composition of the emitted light and can be matched with the action spectra of plants or specific photo-chemical reactions.
Direct & diffuse sunlight
Outside our atmosphere, all sunlight travels in a straight line from the source (sun) to exposed surfaces (e.g., an object at the surface of Earth). Since space is (mostly) empty, sunlight has no opportunity to interact with other particles, but that changes as sunlight enters our atmosphere.
Our atmosphere contains a variety of particles (gas molecules, water vapor and particulate matter) that can change the direction of sunlight. On a clear day, there are fewer particles in the atmosphere and sunlight travels mostly unimpeded before it reaches the ground. We call this type of sunlight direct light or direct radiation. Direct light creates clear shadows as it strikes vertical surfaces (assuming the sun isn’t positioned directly overhead). On cloudy days, our atmosphere contains many particles (especially water vapor) and the interaction of sunlight with all those particles causes directional changes that are mostly random. As a result, on cloudy days, sunlight comes from many directions, preventing the formation of clear shadows.
These frequent light-particle interactions will also result in a reduction in light intensity compared to direct radiation. We call this type of sunlight diffuse light or diffuse radiation. Depending on the makeup of the atmosphere (more or less cloudy), sunlight will reach the surface as direct radiation, diffuse radiation or a combination of the two.
We can measure the amounts of diffuse radiation with a light sensor placed behind a disc that casts a precise shadow over the sensor so it blocks all direct radiation. We then determine the amount of direct radiation by using a second sensor that measures total (direct plus diffuse) radiation (direct radiation = total radiation – diffuse radiation). So, depending on the cloud cover, the amount (intensity) of diffuse radiation is either less than (sunny day) or more than (cloudy day) the amount of direct radiation. However, because diffuse radiation is omnidirectional, it’s able to penetrate deeper into a plant canopy (particularly in a multi-layered, taller canopy).
Direct radiation isn’t able to reach lower canopy layers that are shaded by plant tissues (mostly leaves) that are positioned above and thus block this kind of radiation. Therefore, while the amount of diffuse radiation may appear small, it can boost plant production because it reaches more of the plant surfaces involved in photosynthesis.
Some greenhouse glazing materials (e.g., polyethylene film) diffuse incoming solar radiation more than others (e.g., glass), and while the overall light intensity is often lower in greenhouses covered with a diffusing glazing material, crop growth and development isn’t necessarily reduced because more of the canopy surfaces are receiving adequate light for photosynthesis.
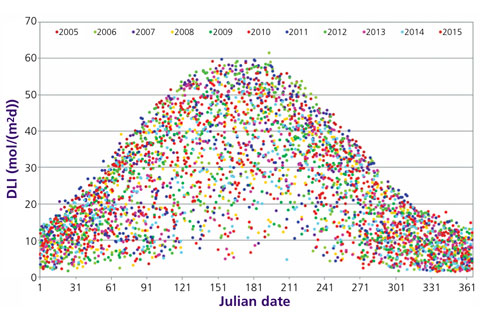
Figure 1. Daily light integral (in mol•m-2•d-1) for Geneva, New York, for the period 2005-2015. The Julian date represents the day of the year, numbered sequentially. The light measurements were conducted with a PAR sensor. Original data source: National Renewable Energy Laboratory, Golden, Colorado.
Sunlight & the greenhouse structure
As sunlight reaches the outside of the greenhouse structure, several things can happen: the light can be reflected, absorbed or transmitted. Often these processes occur simultaneously. The quantities of reflected, absorbed or transmitted light depend on the (glazing) materials involved, the time of day, the time of year and whether the grower uses any control strategies (e.g., white wash or shade curtains).
In addition, overhead equipment can block light and reduce the total amount of sunlight that reaches the plant canopy. It’s not uncommon, even in modern greenhouses, for the plants to receive around 50% on average of the amount of sunlight available outside the greenhouse structure. And since every percent more light received by the plant canopy counts, it really is important to design greenhouses carefully with optimum light transmission in mind.
Photosynthetically Active Radiation
Plant scientists have defined the Photosynthetically Active Radiation (PAR) waveband as the one that primarily impacts photosynthesis. This waveband extends between 400 and 700 nm and is thus slightly narrower than the visible waveband. As a result, we need a special sensor (typically referred to as a quantum sensor) to measure PAR. The instantaneous PAR intensity is expressed in the units μmol•m-2•s-1.
The definition of PAR implies that plants don’t use light outside the PAR waveband for photosynthesis. This isn’t entirely true, and in addition, some light with wavelengths just outside the PAR waveband are used by some plants for a variety of metabolic processes (e.g., the stimulation of anthocyanin production in red lettuce by UV radiation or the increase in photosynthesis as a result of a small amount of far-red radiation). Therefore, PAR measurements don’t always tell the whole story and additional measurements (e.g., using a spectroradiometer) may be required to assess the impact of a particular light source on plant growth and development.
Electric lighting
Because of the relatively low light transmission rates of many greenhouse structures and lower solar radiation amounts during the winter months, growers are often forced to use supplemental electric lighting to maintain vigorous plant growth year-round. Electric lamps use a variety of technologies to produce either fixed spectra (e.g., high-intensity discharge lamps such as high-pressure sodium and metal halide lamps) or adjustable spectra (tunable light emitting diode lamps).
The newer LED lamps offer significant advantages over traditional technologies (HPS and MH), but the range of options is so extensive that it’s almost like researchers have to rediscover how best to use supplemental lighting to produce high-quality crops. Thus, it may take some time before optimum lighting strategies are available for all the different greenhouse crops and their growth stages.
Light uniformity
We’re all familiar with the shadows cast by overhead equipment and greenhouse structural components. If these shadows remain in fixed locations for extended periods of time, plants located in these shadow bands can grow at a reduced rate compared to plants positioned outside the shadow bands. This is why the orientation of a greenhouse can be an issue: in an east-west oriented greenhouse, and during times with low solar angles (wintertime), shadow bands tend to move more slowly. This can be a particularly challenging issue when the crop is grown in the greenhouse for only a short amount of time (e.g., leafy greens).
Aside from shadows, the intensity of sunlight is considered uniform throughout the growing area, but that isn’t necessarily the case for electric lighting. All lamps create so-called hot spots—areas close to the lamps with higher intensities and areas further away with lower intensities. Designing a lighting system that reduces this potential non-uniformity is possible, but requires special attention regarding lamp placement (e.g., lamp mounting pattern, distance between lamps, mounting height above the canopy).
Optimizing light uniformity becomes an even bigger challenge when lamps are placed both above and inside a plant canopy. An example of such a design is HPS lamps installed overhead and LED lamps placed inside the crop canopy. In this case, plants are receiving radiation from three different light sources (including sunlight) that each deliver a different spectrum and a different intensity.
What can you do?
• Measure light conditions (use the appropriate sensors), observe daily and seasonal changes, and assess the light needs of your crops.
• Assess the importance of light uniformity for specific crops and consider improvements when uneven growth patterns are observed that can be attributed to the lighting system.
• Keep up to speed on the latest developments in LED technology (read product literature, visit trade shows, talk to fellow growers about their experiences).
• Conduct small-scale experiments with different light sources for different crops; assess what works and what doesn’t.
• Reach out to researchers who are investigating supplemental lighting strategies for crop production.
• Monitor electric energy consumption for crop lighting and periodically evaluate alternative strategies (e.g., switching to more efficient light sources or reducing the number of hours the lighting system is turned on). GT
A.J. Both (both@sebs.rutgers.edu) is a Professor and Extension Specialist, and Tim Shelford is a Research Associate at Rutgers University in New Brunswick, New Jersey.