A mea culpa from last week
Last time, I gleefully sent you the scoop on Dr. Marvin Miller’s initial analysis of the new USDA Floriculture Crops data. Only, like a faulty box of Raisin Bran, I only gave you part of the scoop, not the full two scoops you should have gotten. That’s because Marvin’s email confused me—there was a big gap in the copy that I took to be the end. I didn’t scroll down far enough to find lots more good stuff, including his famous pie charts.
To make up for my gaffe, here is Marvin’s analysis once again and this time from start to finish:
USDA’s National Agricultural Statistics Service released the Floriculture Crops data for the 2021 calendar year last week. This now details production and sales for all 50 states, 28 of which are separately enumerated, while the other 22 are grouped into “other states.” This compares to only 17 states previously included in the program in 2020. This report has also added 30 new crops to the annual report, which has increased the program coverage for all industry segments. Unfortunately, there's no “tidy” report format such as we’ve had in the past, with all data on any crop presented in one table. Instead, one must know what stat(s) you're looking for, query USDA’s Quick Stats app and then that stat(s) is downloaded. (Author’s note: FRUSTRATION in ALL CAPS!!!)
Nevertheless, I've pieced together a preliminary look at the data and offer the following:
1. The total sales for all 50 states for 2021 was $6,430,424,000. This compares to $5,544,587,000 reported for 50 states in the 2019 Census of Horticultural Specialties, which was the last USDA report on 50 states of floriculture sales. This suggests we have had an increase of 15.98% over the two years ($885.8 million).
2. For the 17 states that were the basis of the 2020 Floriculture Crops Summary, the 2021 tally was $5,100,855,000. This compares to the 2020 total of $4,645,297,000, which suggests an increase of 9.8% over just the last year in these 17 states.
3. The number of floriculture producers totaled 9,558 in 2021 across the 50 states. For the 17 states surveyed in 2020, the 2021 grower count increased by 8.1%.
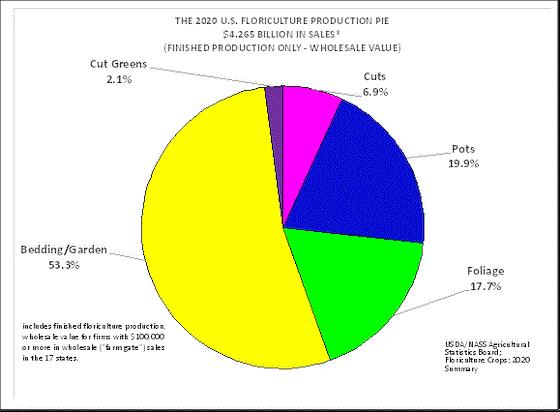
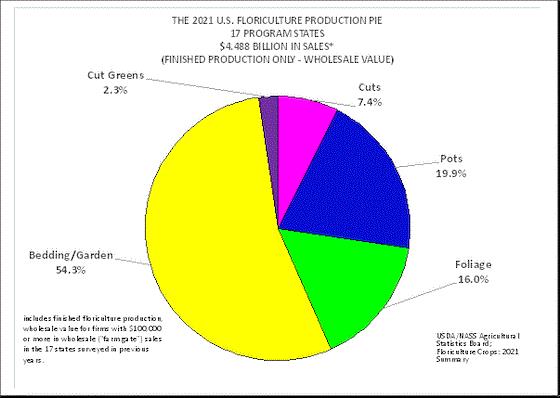
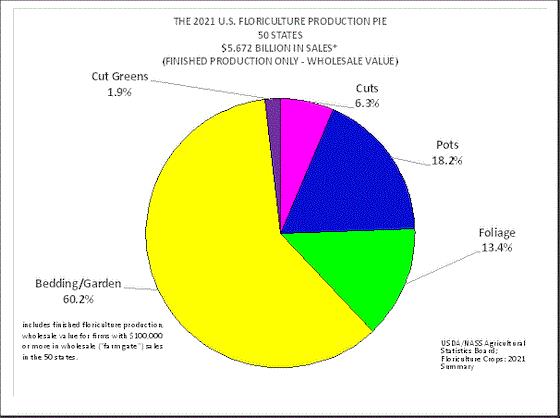
4. The 2021 Floriculture Production Pie chart of finished floriculture sales for the 50 states looks a bit different than the chart based on the 2020 report of 17 states and even the chart one might draw from those same 17 states using 2021 data.
What becomes immediately obvious is that the bedding/garden segment is much larger when all 50 states are considered, and this increase is at the expense of all other segments of the industry (or slices of the pie).
Here are three pie charts comparing 2020 (top) with the same 17 states in 2021 (center) and finally the results for all 50 states in 2021 (bottom):

The size of our industry (continued)
5. In year-to-year comparisons of the 17 states surveyed in 2020 and the same 17 so-called “program states” surveyed in 2021, reported sales increased for all industry segments except for foliage. Additionally, it should be noted that for the first time ever, the foliage sales were collected as a record of sales dollars generated. In all previous survey years, foliage sales were reported as a value added for each foliage grower’s efforts.
6. Florida remains the number one state in the survey, accounting for 17.3% of the 50-state total in sales with $1.115 billion. California ranks second with $962.5 million, accounting for 15.0% of total floriculture sales. At No. 3 is Michigan with $635.3 million, accounting for 9.9% of the total. These three states account for over 42% of all sales recorded in the survey. Still, there are a record 18 states each with over $100 million in sales and there are another nine separately enumerated states with over $50 million in sales. Alaska is the only other separately enumerated state (with only $13.5 million in sales). Collectively, the remaining 22 states (“other states”) account for $366.3 million in sales (5.7% of the total).
State Sales Total % of 50-state total
Florida* 1,114,812,000 17.3%
California* 962,498,000 15.0%
Michigan* 635,258,000 9.9%
New Jersey* 355,613,000 5.5%
Ohio* 269,084,000 4.2%
Texas* 253,220,000 3.9%
North Carolina* 198,800,000 3.1%
Pennsylvania* 188,187,000 2.9%
New York* 180,533,000 2.8%
Connecticut* 165,014,000 2.6%
Wisconsin* 148,165,000 2.3%
Virginia* 144,537,000 2.2%
Oregon* 143,854,000 2.2%
Minnesota 138,432,000 2.2%
Maryland 121,539,000 1.9%
Washington* 113,222,000 1.8%
Colorado* 111,517,000 1.7%
Illinois* 103,076,000 1.6%
Utah 96,839,000 1.5%
Iowa 89,917,000 1.4%
Georgia 89,416,000 1.4%
Alabama 84,219,000 1.3%
Massachusetts 82,014,000 1.3%
South Carolina 76,954,000 1.2%
Tennessee 75,727,000 1.2%
Indiana 56,890,000 0.9%
Hawaii 51,322,000 0.8%
Alaska* 13,465,000 0.2%
Other States 366,300,000 5.7%
U.S. TOTAL 6,430,424,000 100.0%
17 Program States *4,645,297,000 72.2%
*The 17 program states are those surveyed in the 2020 edition of the Floriculture Crops Summary.
Thank you, Dr. Miller! My apologies for the truncation (after point 4) the last time.
Comments or thoughts on the data? Email me at beytes@growertalks.com or Marvin at mnmiller@ballhort.com.

In memoriam: Dr. Robert O. (Bob) Miller
I’m sorry to report the passing of esteemed bulbman Dr. Bob Miller, long-time teacher, researcher, grower and all-around horticultural character. He passed away at the age of 92 after a battle with bladder cancer.

His son, Dr. Bill Miller of Cornell University and another noted bulbman (is that a thing or did I just make it up), shared the following about his dad:
Bob had a long career in floriculture, starting at Ohio State as a beloved professor (1958-1966), doing research on Easter lilies and poinsettias in Wooster and teaching courses in Columbus.
In 1966, he and his family moved to Smith River, California, to join Dahlstrom & Watt Bulb Farms, and shortly thereafter began a program of greenhouse construction to supply the West Coast markets. Always a major Easter lily bulb supplier, he moved heavily into foliage propagation, shipping rooted cuttings throughout the U.S. Over time, D&W also became a major supplier of dormant hydrangeas for spring holiday markets.
Bob was an informative and popular speaker at the Ohio Short Course and served many years as a director of the Seeley Conference. He was loved by numerous former students and industry associates, who appreciated his quick wit, to-the-point manner and engaging storytelling.
He retired from D&W in 2007 and became a master woodworker. He's survived by his wife, Alice, and five children: Jim, Rob, Bill, Brian and Jennifer, 11 grandchildren and seven great grandchildren.
Bob was one of those people who had many, many friends over the years, all of whom seem to have amazing stories to tell of their adventures with him. If you’ve got something special to share about Bob, do so HERE.

How was Memorial Day?
Three-tenths of a point above average in the U.S. and two-tenths of a point above average in Canada, if you believe my numbers (and you should, because they’re your numbers).
The results for Memorial Day 2022: 8.3 in the U.S. and 8.5 in Canada. Hot dog!
Here’s your map:
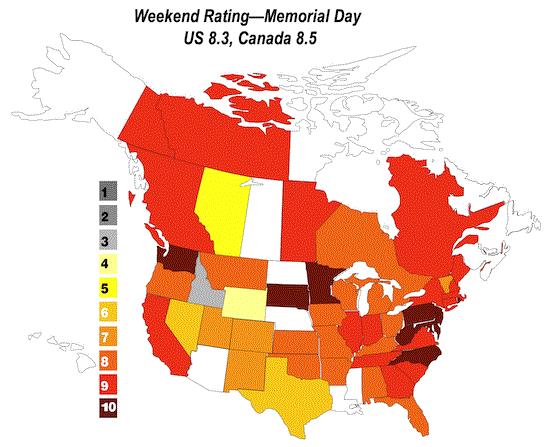
That’s based on 102 scores from 43 states and 9 provinces (I finally heard from the Northwest Territory and Yukon!).
As good as that is, when the scores started coming in earlier this week it was looking less than stellar. I kept seeing 7s. I was sure Memorial Day 2022 was off. Your comments were measured, but sanguine. Wrote Brian Sabo from northeast Ohio in explanation of his score of 7.5, “Saturday/Sunday a little slow [but] Monday was strong! Customers buying … well, just not as many as we need.”
Bruce Gescheider in northern Nevada scored his weekend a 6, explaining, “Cool and windy did not help, but still a big weekend to end the month ... just not as big as needed to catch up versus year-ago transactions and revenue.”
But a full 24% (24 out of 102) of you rated your weekend a perfect 10, which means it was better than I was estimating. Twenty-three percent of you scored your weekend a 9, 2% an 8, and just 110% a 7. So not as bad as I first thought!
Abe VanWingerden’s scores from Metrolina Greenhouses were reflective of that. As I’ve said before, Abe sends me detailed scores for 16 Southern, Eastern and Midwest states, and he’s always thoughtful about the data and his analysis. Wrote Abe, “And it rings true: Give us good weather and we will give you good sales.” (He included a smiley emoji after this.)
Abe sent in eleven 10s, three 9s, an 8 and a 7, saying, “North had its BIGGEST day of the year Saturday, with stores in Maryland, Pennsylvania, New Jersey and New York all having bigger Saturdays than Mother’s Day Saturday this year, and 2X/3X last year Memorial Day weekend sales (it was a rainout last year).”
Abe added this note about the compressed sales season we’ve all experienced:
“We have made up some big ground, and getting a strong Memorial Day weekend always creates momentum through July 4 on fill-in purchase and everything else. Additionally, the product mix this weekend was very ‘gardening’ driven, with heavy sales on packs and potted items that give the indication of gardening starting later this year versus just hanging basket and container sales, which show more decorating for the holiday.”
Interesting point, Abe! I never considered what pack/pot vs. basket/combo sales indicate. That’s why you run a giant nursery and I just write about it, I guess.
Maybe part of my problem is that I’ve gotten so used to 10s the last two years that I’ve lost sight of how good sales of 8 can be. Chris Williams in Wisconsin wrote of his 8, “A decent finish to a spectacular sales month.” And Debbie Lorenzo in Montana said of her 8, “Probably one of the better Memorial Day Weekends due to the sluggish start of the season.”

Compared to Memorial Days of yore
With 2022 being such a weather-impacted season, it’s been helpful to compare it to previous years to put it in perspective. This exercise helped me see Memorial Day 2022 for being better than I first thought. Here’s the historical data:
Score % of 10s
2022 8.3/8.5 24
2021 7.5/8.0 24
2020 9.2/9.4 59
2019 7.7/6.6 23
2018 7.4/9.3 18
2017 7.9/8.7 23
2016 8.1/8.8 21
2015 7.7/8.6 28
2014 9.0/7.8 45
2013 7.4/7.4 11
Average 8.0/8.3 28
As you can see, our 8.3 in the U.S. is the third-best score in the last 10 years. Amazing! And Canada’s 8.5 was two points above the average. Five years were better, four were worse … As usual, when we don’t have a pandemic raging, it’s all about the weather.
Meanwhile, up in Whitehorse and Yellowknife …
Rainbow Greenhouses finally ran its trucks up to Yukon and the Northwest Territory—a 24-hour drive from their base in Chilliwack, British Columbia—and CEO Stan Vander Waal reported a 9 for both the remote territories of Canada that he ships to—“and they want more yesterday!” he exclaimed.
Stan was the most upbeat of all my Canadian contributors, writing, “Well, it’s turned! Overall, it was a great weekend and week. We’ve made some serious gains on the numbers with the change in weather … No question this was the peak week of the year, with over 13,000 racks shipped this week! The good news: we didn’t run out of racks.”
Stan also gave scores of 9 to BC, Alberta and Saskatchewan. Manitoba got a 6 due to mixed weather.
I told Stan that one of these years I’m going to catch a ride in one of his trucks to see one of these territories for myself. He called the long ride “Beautiful & Wild.” That will be a fun story to write!
(Not to leave out the rest of Canada, Alberta averaged 7.0, BC averaged 9.0, Manitoba 7.5, Ontario 8.3 and Quebec was 9.)

Meet our Young Grower, Young Retailer Award finalists
At the end of the month (June 28 and 29 to be precise), Green Profit managing editor Jen Polanz and I will be doing live online interviews (interrogations?) with our six Young Grower and Young Retailer finalists. It will be a do-not-miss pair of webinars!
Our six finalists are bright, energetic, motivated and full of ideas for how their chosen field can do even better, and Jen and I will be pulling all those great ideas out of them during a pair of hour-long Q&A sessions. The primary focus will be on how they've been facing, and will continue to face, the challenges of 2022, including rising costs, soaring inflation, supply chain delays, labor shortages … all the fun stuff!

Young Grower Award finalists Quinten Henning, Mike Krueger and Erika Ramos.

Young Retailer Award finalists Casey McCollum, Ashleigh Munro and Will O'Hara.
The Young Grower session will be Tuesday, June 28; the Young Retailer webinar will be the next day, Wednesday, June 29. Both are slated for 1:00 p.m. Eastern/Noon Central.
Sign up at www.growertalks.com/webinars.
And both sessions are free, thanks to our award sponsors Ball Horticultural Company, The Garden Center Group and AmericanHort.
Oh, while you're there, don’t forget to sign up for next week’s free webinar, “Greenhouses: Traditional vs. New Technology.” It's Wednesday, June 8. I’ve got guests from greenhouse manufacturer Prospiant and environmental controls specialist Argus who'll wax poetic about all sorts of greenhouse technologies, systems and trends. I can't wait!

Finally …
Here’s something interesting that the American Horticultural Society has been working on: The 50 State Flower Garden Project. It’s a collaboration with several national partners to “celebrate the beauty and diversity of America’s horticultural heritage and traditions.”
According to AHS, the project is designed to highlight the personal and inspirational stories of the farmers, flower growers, gardeners, horticulturists and artisans “who root us together in common ground and the pursuit of beauty.”
Flower growers? Hey, that's us!
The objective of the project is to expand the definition of state flowers (which were last updated in the 1900s) to showcase the diversity of botanical varieties nationwide, along with the stories and the people behind them. The goal is to highlight our shared roots in flowers through a combination of public exhibits, illustrative designs, exclusive products and media features, eventually resulting in a modern flower garden representing every state based on flowers that actually grow there, beyond the legislatively-mandated varieties. AHS and its partners hope to “update and modernize” our understanding of what defines a state’s most iconic flower.
AHS’s partners in the project are Certified American Grown, Gibson & Dehn Candles, Anna Weatherley Designs and FlowerPowerDaily.com.
It was Jill Brooke of FlowerPowerDaily.com who first clued me in to this; I replied that identifying what a flower farmer is would be the first challenge. Do my greenhouse and nursery folks count? Or does it have to be a guy or gal in a field with a straw hat and overalls? She said with that question, I’d just gotten myself suggested for the judging committee.
Just letting you know I do NOT take bribes.
For more project information, contact Jill Brooke at jill@flowerpowerdaily.com.


Feel free to email me at beytes@growertalks.com if you have ideas, comments or questions. Beefs, even ... especially if barbecued!
See you next time!

Chris Beytes
Editor
GrowerTalks and Green Profit
This e-mail received by 25,730 loyal readers!
Thanks to my loyal sponsors, who help me reach the 25,730 readers of Acres Online in more than 60 countries. Want to be one of them (a sponsor, that is)? Give Paul Black a shout and he'll hook you up.