8/1/2022
Data From the 50-State Floriculture Crops Survey, Continued
Dr. Marvin Miller
Editor’s Note: The first part of Dr. Miller’s analysis ran in the July In Brief section. Go to www.growertalks.com to see the first part if you’d like a refresher.
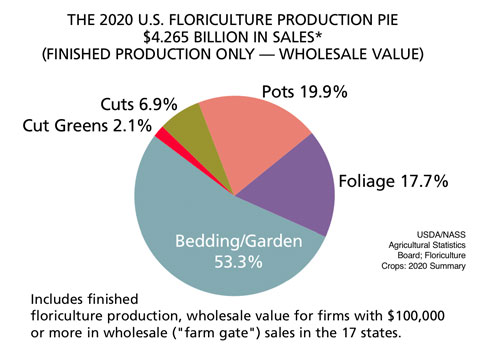
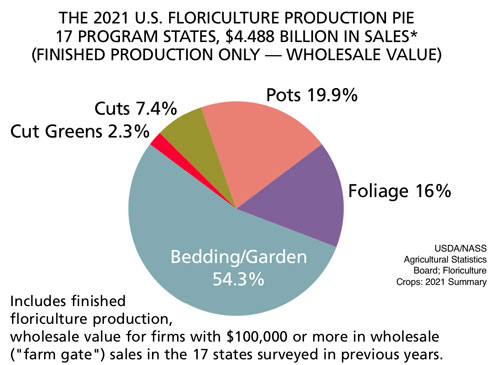
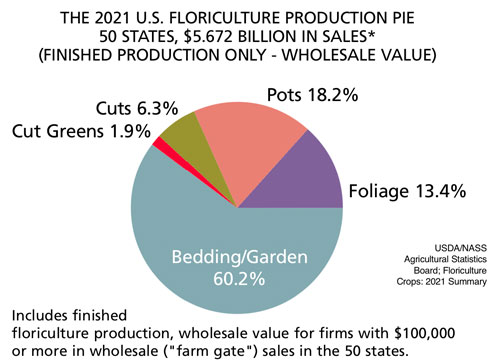
The 2021 Floriculture Production Pie chart of finished floriculture sales for the 50 states looks a bit different than the chart based on the 2020 report of 17 states and even the chart one might draw from those same 17 states using 2021 data.
What becomes immediately obvious is that the bedding/garden segment is much larger when all 50 states are considered and this increase is at the expense of all other segments of the industry (or slices of the pie).
On the next page are three pie charts comparing 2020 with the same 17 states in 2021 and the results for all 50 states in 2021.
In year-to-year comparisons of the 17 states surveyed in 2020 and the same 17 so-called “program states” surveyed in 2021, reported sales increased for all industry segments except for foliage. Additionally, it should be noted that for the first time ever, the foliage sales were collected as a record of sales dollars generated. In all previous survey years, foliage sales were reported as a value added for each foliage grower’s efforts.
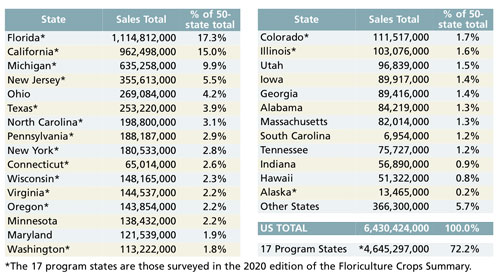
Florida remains the number one state in the survey, accounting for 17.3% of the 50-state total in sales with $1.115 billion. California ranks second with $962.5 million, accounting for 15% of total floriculture sales. At No. 3 is Michigan with $635.3 million, accounting for 9.9% of the total. These three states account for over 42% of all sales recorded in the survey.
Still, there are a record 18 states each with over $100 million in sales and there are another nine separately enumerated states with over $50 million in sales. Alaska is the only other separately enumerated state (with only $13.5 million in sales). Collectively, the remaining 22 states (“other states”) account for $366.3 million in sales (5.7% of the total). GT