2/1/2021
Hortistician Marvin Miller on the Latest USDA Data
Chris Beytes
The U.S. Department of Agriculture’s National Agricultural Statistics Service released both the 2019 Census of Horticultural Specialties and the Floriculture Crops: 2019 Summary in December, and both contained surprises, says Dr. Marvin Miller, our in-house hortistician, who reads between the spreadsheet lines for us. Here’s his take on the data:
While the first survey is conducted across all 50 states once every five years, the latter is conducted now in 17 states, but annually. Among the 17 states, 15 tend to be the largest states in the production and sales of floriculture crops.
In the Census, there appear to be about 12% fewer producers in 2019 than were reported in 2014, but we still have 10,939 firms identified as producers of floricultural products (out of 20,655 firms in the entire Census report, which also covers nursery crops, sod, Christmas trees, both flower seed and vegetable seed production, food crops grown under protection, and a number of other horticultural specialties). In the Floriculture Crops Summary, the respondent numbers appear to have dropped almost 19% from 2018 to 2019; there are 5,198 firms reporting in this survey.
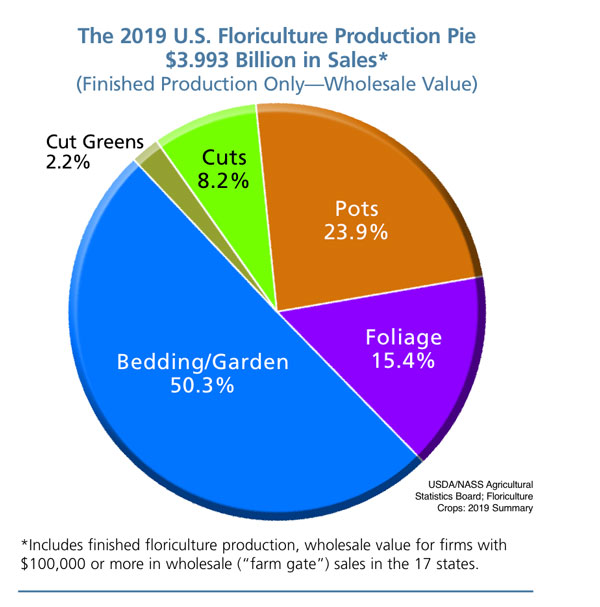
Total floriculture sales in the Census, $5.545 billion, dropped 5.7% over the five-year period from 2014 to 2019, while the Floriculture Crops Summary reported a 7.3% decline from 2018 to 2019 to $4.417 billion. Sales of finished floriculture crops dropped only 4.3% from 2018 to 2019 to $3.993 billion in the latter survey.
There was a drop in producer numbers in the Floriculture Crops Summary for every sales range, though the largest percentage drops occurred among those producers with less than $100,000 in sales; these smaller growers only accounted for 2.5% of the report’s total sales, even though they accounted for 48.6% of total grower numbers in 2019.
Among floricultural crop categories, the Census reported fewer 2019 sales for both annuals and perennials, and for foliage plants and cut flowers, with only potted flowering plants and cut greens reporting increases over the five-year period. In the Floriculture Crops Summary, only the potted flowering plant category showed sales increases from 2018 to 2019.
There are a few comments worth noting about these data at the outset. First and foremost, it is important to remember these numbers are all pre-pandemic. We certainly expect the more recent 2020 figures, which we will likely see next spring, will reflect an industry surge from the 2019 figures.
Secondly, there was a fair amount of shift taking place in the marketplace in 2019. Arguably the largest operation at the time, Color Spot Nurseries, was in bankruptcy in 2018, and it emerged from bankruptcy following the sale of its Hines Nursery division to TreeTown USA (now Everde Growers) and the acquisition of the rest of the company by its primary lender, Wells Fargo Bank in August 2018. During its bankruptcy, three of Color Spots’ large production facilities were closed. In December 2018, the remaining Wells Fargo-owned assets in California and Texas were purchased by Altman Plants.
While all of this was happening, we also saw a number of states legalize marijuana production, while the U.S. government legalized hemp production nationwide. As a result, a number of operations both big and small have ceased floriculture production in favor of producing some form of cannabis.
All things considered, the loss of producer numbers and production value are quite conceivable, but there will be further analysis in the coming weeks. Stay tuned. GT