5/1/2019
Sensing the N
Ranjeeta Adhikari, Cheng Li & Krishna Nemali
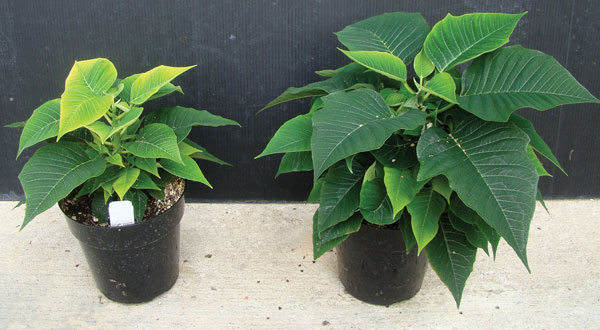
Nitrogen (N) is one of the important essential elements for optimum growth and quality of floriculture crops. Nitrogen deficiency results in stunted plants with yellow leaves and poor quality (Figure 1). Sometimes, it’s too late to adjust the N supply and maintain plant quality after visually detecting N deficiency symptoms. There are also instances when growers apply too much N to plants. In addition to causing a toxic effect on plants, most of the excess N will simply leach out of the containers as nitrates and pose environmental hazards.
Figure 1. Poinsettia plants grown with deficient (left) and sufficient levels of nitrogen in the substrate.
Growers usually manage N supply to plants using electrical conductivity (EC) measurement in the fertilizer solution. Maintaining EC of the fertilizer solution doesn’t always result in optimal levels of N in plants. After N application through fertilizer solution, factors like substrate composition, pH and plant growth rate affect the amount of N uptake, assimilation and storage by the plant. Therefore, it’s important to assess plant tissue N content to ensure that N levels are optimal in plants.
Filling the nitrogen-testing need
Laboratory-based techniques are available to measure N content in the plant tissue, however, it usually takes a week or longer to obtain laboratory test results. This may be too late to correct for N levels in the plants without losing plant quality. Moreover, testing samples in a laboratory can be expensive (on average $20/sample).
There are sensors like SPAD and chlorophyll meters that can quickly estimate N status of plants with reasonable accuracy. However, these sensors are expensive ($1,500 to $3,000) and their use has been mainly limited to academic research. Unfortunately, we don’t have affordable and easy-to-use sensing devices that can detect N deficiency or toxicity early during production. The floriculture industry needs simple, rapid and cost-effective tools that can aid in measurement of N content in plants.
Nitrogen deficiency can decrease the ability of plants to absorb light that falls on leaves. This is because N deficiency can decrease chlorophyll content and chlorophyll is involved in light absorption. Thus, N deficiency can indirectly decrease light absorption or increase reflectance from plants. By measuring the extent of light reflection, especially red wavelengths, we can indirectly estimate the N status in plants.
Smartphones have become so popular that they’re almost a necessity to us now. In addition, low-cost and good-quality miniature cameras and micro-controllers are increasingly becoming available to us. Our big idea was to develop a low-cost nitrogen sensor that uses a smartphone to measure red light reflectance and N content in plants. This technology can be user-friendly, affordable and easily adopted by many growers. Once developed, the technology can be easily transferable to large-scale operations as well.
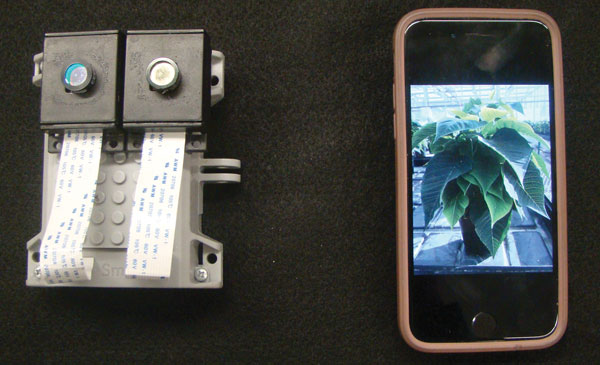 At Purdue University, we built a nitrogen sensor using miniature cameras and a micro-controller (Figure 2). Called “N-sensor,” the total cost is approximately $135. The developed sensor uses light filters that selectively capture red (R) and near infrared (NIR) images of plants based on light reflecting from plants. The N-sensor measures the extent of R light reflected from plants. We also wanted to measure the extent of NIR light reflected from plants, as NIR reflectance is a good indicator of plant size and light environment, and can be used to adjust for differences in plant size and light intensity on a given day. The technology will also work under supplemental lights used in greenhouses.
Figure 2. Nitrogen sensor built by using a micro-processor, miniature cameras and filters.
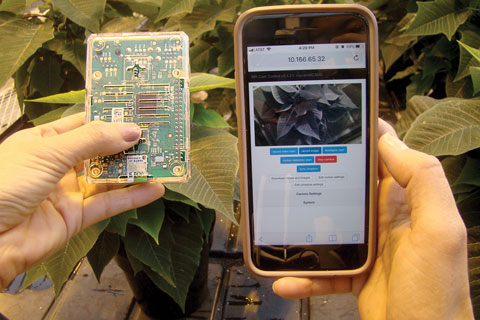
Growers can measure groups of plants at a time using this technology. (It may be useful to measure the same set of plants over time to track changes in N content in plants.) To measure N content, a smartphone should be connected to the N sensor (Figure 3). For this, growers can use any web browser on their phones and log in to a website developed by us for monitoring plants. After connecting the smartphone to the N sensor using the website, growers select species and take R and NIR images by clicking on respective camera tabs on the webpage (see Figure 3). Next, the images from the smartphone are sent to a network server (managed by Purdue University) with user-credentials, where the images are quickly processed for plant N status. The server hosts image analysis software developed by us using Matlab and C++ language. The processed images and results of plant N content are returned to the user’s smartphone.
Figure 3. Taking pictures with the nitrogen sensor connected to a smartphone on a wireless network.
Trial results
An experiment was conducted in a temperature-controlled greenhouse at Purdue University to test the efficacy of the developed N-sensor and software to distinguish the “reflectance signature” of poinsettia plants grown under deficient, optimal and high levels of nitrogen in the fertilizer. Poinsettia (Christmas Beauty Marble) plants were grown at five different EC levels (0.75, 1.5, 2.5, 3.5 and 4.5 dS•m-1 or 112.5, 225, 375, 525 and 675 ppm N, respectively) under sub-irrigation to generate a range of tissue N levels in plants.
After four weeks of growth under different treatments, R and NIR images were taken from each plant using the N-sensor connected to a smartphone. A whole shoot was harvested from each plant and dried plant material was thoroughly mixed and analyzed in a laboratory for tissue N content. In our preliminary model, the images from the smartphone were sent to a computer (instead of a server) for processing, where the developed image processing software was stored.
The developed software processed R and NIR images (Figure 4) first by identifying plant pixels in the image and then measuring grey value of each plant pixel in the image. Average grey value is a measure of reflectance from plants on a specific scale. Our technology uses a greyscale between 0 and 255. On this scale, a grey value of “0” indicates complete absorption or no reflection of light and 255 indicates complete reflection of light.
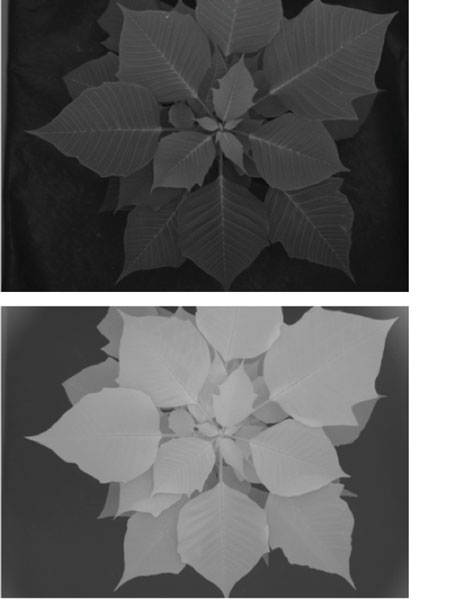 Figure 4. Greyscale images of red (top) and near infrared (bottom) reflectance from a poinsettia plant.
Greyscale images of R and NIR wavelengths indicated that, as expected, more NIR was reflected than R by plants (i.e., brighter image = higher grey value = more reflection, see Figure 4). Using the estimated reflectance from R and NIR images, we calculated a “reflectance ratio (Rratio)” as the ratio of average greyscale value of NIR to R. This was done to adjust for differences in plant size and light environment on the day of measurements. Our hypothesis was that the Rratio is proportional to tissue N content in plants, as it’s an index of extent of red light reflected by plants.
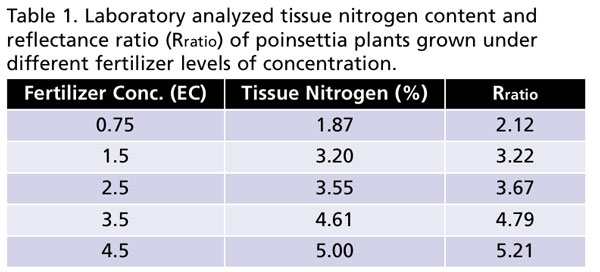
We found that as fertilizer concentration increased, tissue N content also increased in the plants (Table 1). Interestingly, Rratio also proportionately increased with increasing fertilizer concentration supplied to plants. More importantly, tissue N content and Rratio were closely related, as higher tissue N also resulted in higher Rratio (Table 1). This supports our hypothesis that Rratio can be used to estimate tissue N content in plants. Note that Rratio was estimated using images of plants taken by the N-sensor connected to the smartphone. Our preliminary results indicate that smartphone-based technology has potential to measure tissue N content in plants.
 Our future work is focused on developing smartphone technology for several species and varieties of ornamental crops grown in greenhouses and nurseries. We also plan to develop several N-sensors and test them in greenhouses and nurseries across the U.S. by collaborating with growers. We’re thankful to the Fred Gloeckner Foundation, American Floral Endowment and the Horticultural Research Institute for their support towards research and extension activities associated with this project. GT
Krishna Nemali is an Assistant Professor and Extension Specialist, and Ranjeeta Adhikari is a Ph.D. student in the Department of Horticulture and Landscape Architecture at Purdue University. Cheng Li is a visiting student from the China Agriculture University in Beijing, China.