11/1/2018
Waste of Space
Juan C. Vallejo, Paul R. Fisher & Alan W. Hodges
Because greenhouse production is highly capital-intensive, it’s important to know exactly how full your greenhouse is on a weekly basis. Empty greenhouse space increases the cost of plants grown in that space because overhead costs—for example, depreciation and heating—have to be divided into fewer plant products sold. Increasing “space-use efficiency” (the proportion of your production area that’s filled with crops) is one of the most effective ways to reduce unit production cost.
Unused space represents an opportunity cost because there’s a potential to grow additional products and generate extra revenue (Figure 1). During the peak season, having accurate information about space is especially important. In the off-peak, tracking available space may be less important if low market demand means that space isn’t limiting and extra product couldn’t be sold.
Tracking space is important when allocating overhead costs to plant products. “Square foot weeks” (sfw, the space required per container times the production time) are often used to allocate overhead costs (see sidebar). If you’re using sfw in your costing model, it’s critical to have accurate information about space utilization (how many sfw are actually used over the course of a year). If you overestimate your space use, you’ll underestimate overhead/square foot week and underestimate the cost for each plant product.
Therefore, every grower should track space use on a weekly basis. There are three approaches to estimating space use:
• Estimate the percent that the greenhouse is full throughout the period of a year (an approximate value based on experience and production numbers).
• Inventory basis (number of each plant product category and the space per plant product) using spreadsheets or inventory planning software.
• Physical walk-through of greenhouse structures every week.
One of the growers we visited walks his greenhouse every Monday to get the space-use percentage. He considered it important to check on the same day in a consistent manner and preferably not on a Friday when the areas were regularly empty after weekly deliveries.
In addition, one of the authors, Juan Vallejo, manages a propagation greenhouse for cut flowers in Ecuador. At Esmeralda Greenhouse, they use drones to photograph benches inside the greenhouse and analyze the resulting digital images to track space use.
Study methods
Over a 12-month period, we ran a study where we visited 14 companies around the U.S., collecting information about greenhouse space. Of these companies, six companies didn’t have a formal weekly tracking system, but estimated space use. Two companies tracked space use only during peak and six company owners tracked weekly space use using either inventory or walk-through approaches.
The study included 17 greenhouse structures with a total of 4.78M sq. ft. of production area. All growers produced young plants for sale during the spring and varied in their crop types at other times of the year.
We quantified both the “footprint efficiency” in each location, defined as the proportion of total floor space that could be effectively filled with plant containers, and the “space-use efficiency,” which represented the percentage of that footprint area filled with plants.
The companies that tracked space use using inventory or walk-through approaches reported their data to us, and we discussed and reviewed their calculations in follow-up interviews. However, it wasn’t feasible for us to independently verify the data by visiting each greenhouse on a weekly basis.
Results
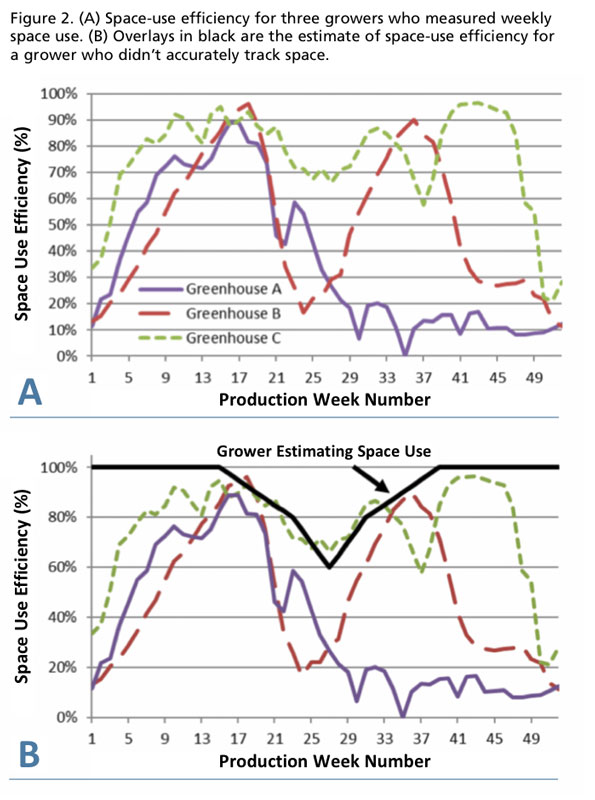
The reported space-use efficiency varied widely between growers. Figure 2A shows three examples. Greenhouse A primarily produced spring bedding crops and was mostly empty for the rest of the year. In contrast, Greenhouse B produced both spring bedding and fall poinsettia plants with two distinct peaks. Greenhouse C further filled space with summer patio plants and chrysanthemums.
The average space-use efficiency over the entire year for Greenhouse A was only 36% (the lowest in our survey) because it was mostly empty in the fall. In contrast, Greenhouse B averaged 50% full and Greenhouse C had the highest space use in our survey at 75%. The space-use efficiency for all six growers who tracked space utilization averaged 54% over the year.
Greenhouses were rarely, if ever, 100% full because short-term crops such as seedling plugs and cuttings were frequently being shipped and planted. Bedding plant growers mentioned that a peak of 80% to 90% may, in fact, be ideal to avoid the need to make management compromises, such as placing crops in a suboptimal temperature and light environment, or breaking up large runs of plants between multiple small zones. A higher space-use efficiency would be possible with long-term crops, such as cut flower roses.
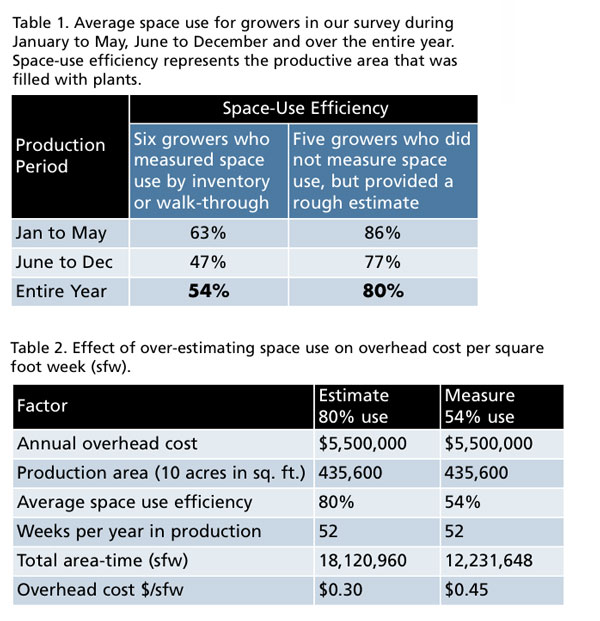
Our survey suggests that in the absence of data from inventory or walk-through, growers over-estimated how full their greenhouse was (Table 1). For example, growers who didn’t measure space-use efficiency estimated that greenhouses averaged 80% full, compared with only 54% full for growers who tracked space (Table 1). Without measuring space use, growers wouldn’t know if open space was available that could be filled with plants that generate more revenue.
This error would also underestimate the “rent” (the cost per sfw for greenhouse space used), which would in turn underestimate production cost for plant products. For example, with a 10-acre greenhouse that has $5.5M in overhead, if the average space use was estimated at 80% full of plants, then the cost per sfw would be $0.30 (Tables 2 and 3). However, if, in fact, the space-use efficiency was only 54%, then the cost per sfw would increase by 50% to $0.45.
With the flat of bedding plants described in the sidebar, increasing from $0.30 to $0.45 overhead per sfw would increase cost per flat by $1.50. Without measuring space use, you may be guessing at total cost and resulting profit margin.
For the Greenhouse A (Figure 2) who shut down the greenhouse in the fall and averaged only 36% full, the overhead cost would be even higher at $0.67 per sfw. The emptier the greenhouse, the fewer plants grown and the higher the overhead cost per plant.
Increased efficiency can help your business thrive in a competitive environment. We recommend that you track space use on a weekly basis in your operation. You can compare your figures against our study benchmarks and also compare year-to-year. There may be potential for increased sales when the greenhouse isn’t completely full and accurate tracking of space is essential when calculating production cost per square foot week.
Juan C. Vallejo, Paul R. Fisher and Alan W. Hodges are with the University of Florida IFAS, in Gainesville, Florida.
Acknowledgements: We thank the industry sponsors in the Floriculture Research Alliance (floriculturealliance.org) and USDA-ARS Floriculture and Nursery Research Initiative #58-3607-8-725 for supporting this research. This study was conducted under IRB-02 guidelines.
Space Use and Square Foot Weeks
The major cost categories for any plant product are direct costs, labor and overhead. Direct costs are for items such as growing media, seedlings and containers that can be directly related to a specific plant product and which vary proportionally to the number of units produced.
 Labor cost is the sum of all wages paid to employees, plus the cost of employee benefits and payroll taxes paid by an employer. This cost of labor can be treated as a combination of direct costs (such as the cost to plant or grade each pot) and indirect (overhead) costs (such as management and sales staff). Overhead expenses are all costs on the income statement other than direct labor, direct materials and direct expenses.
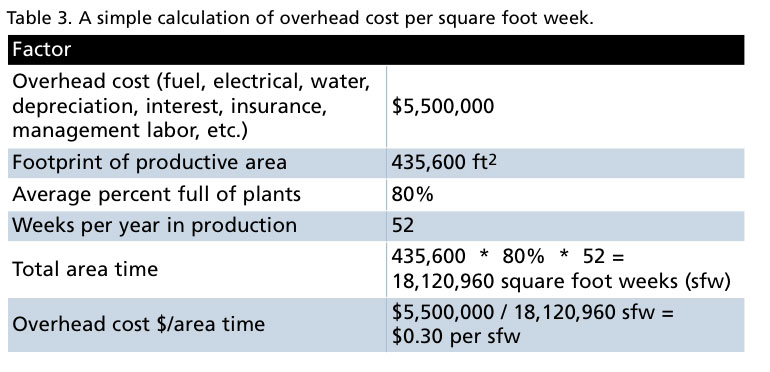
Overhead costs are often allocated to individual plant products using the concept of square foot weeks (sfw). Table 3 shows an example for a business with $5.5M in overhead and 435,600 sq. ft. of production area. If the business is on average 80% full of plant material, there would be 18,120,960 sfw. Dividing the overhead cost by the number of sfw, the overhead cost per sfw would be $0.30.
A square foot week is a way to calculate the growing time and area required per unit, and the resulting overhead cost. For example, a typical bedding plant flat measuring 11 in. x 22 in. requires 242 sq. in., which equals 242/144 sq. in. or 1.68 sq. ft. If the production time is six weeks, the total production area and time is 1.68 sq. ft. x 6 weeks (approximately 10 sfw). If the cost per sfw is $0.30 (from Table 1), the overhead cost per flat would be $0.30 x 10 = $3. GT