2/1/2018
A New Look at Substrates
Paul C. Bartley III, Dr. Brian E. Jackson & Dr. Bill Fonteno
The opaqueness of containers and substrates has caused researchers to exercise some creativity to overcome their lack of visibility. To quantify total pore space and air space at container capacity, we saturate a substrate-filled container with water, weigh it, allow it to drain and weigh it again.
To get an idea of how water may move through the system, we apply pressure to the substrate to derive a sense of the pore structure. If root growth data is being looked at, the most common way to extract the data is by painstakingly hand-washing rootballs. Instead of going through all of these time-consuming and invasive procedures, wouldn’t it be nice to simply see inside?
If a doctor ever needed to non-invasively see inside you, it’s likely that you’ve had the misfortune of experiencing a CT or CAT scan. This donut-shaped, claustrophobia-inducing instrument, once exclusively utilized in the medical and petroleum industries, is finding new uses (and maybe more willing patients) in other research fields.
Since the 1980s when soil/plant scientists began using tomography, the capabilities of CT instruments and analytical software have improved by several orders of magnitude. Images can be captured at the micrometer and nanometer scale and access to a CT instrument no longer requires a doctor’s appointment.
In collaboration with the Shared Materials and Instruments Facility at Duke University, we in the Horticultural Substrates Lab at North Carolina State University are finally capable of seeing our substrates and plants inside and out. In the first installment of this two-part series, we’ll discuss how tomography is changing the way we see and analyze substrates from two-dimensional and three-dimensional imaging.
2D & 3D analysis
Tomography, simply described, is the combination of hundreds or thousands of x-ray images, which are reconstructed to digitally render a 3D object. Tomographic images can be observed in slices, not entirely different from the way we observed bacteria on a microscope slide in Biology 101. Depending on the orientation of the slices one chooses to view (either horizontal or vertical), qualitative, quantitative and some spatial data can be collected by examining 2-dimensional slices of the object.
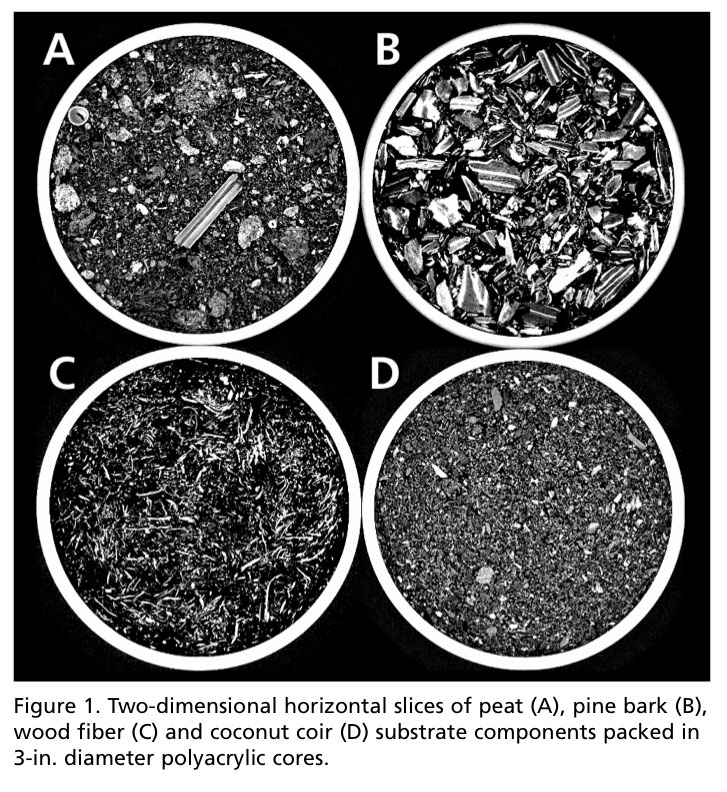
Qualitative analysis, in this sense, is simply visual data. Slices in the horizontal orientation (cross-sectional) can lend inferences to what make some of the most popular substrate components (i.e., peat, coir, pine bark and wood fiber) unique (Figure 1).
Peat may be best described as a heterogeneous mixture of fibrous particles and partially decomposed stems. Coir, thought to be very similar in texture to peat, appeared more homogenous and consisted of granular shaped, sponge-like particles. Pine bark appeared the coarsest and contains particles consisting of two layers—the dense periderm layers (brighter white layers), and less dense layers comprised of crushed phloem and expanded parenchyma cells (grey layers). The elongated, fibrous network of wood fiber substrates visually distinguished it from other materials.
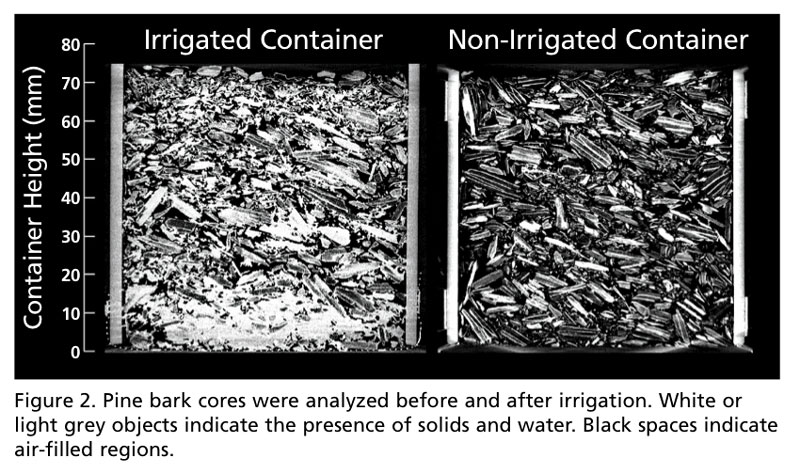
In the vertical orientation, we can better ascertain spatial data, as many physical properties (water-holding capacity, air-filled porosity, etc.) can be influenced by container height, as well as the substrate material. To examine the effect of water on CT scans, two pine bark-filled cores were analyzed, one irrigated and another not irrigated. Since the density of water and organic components are similar, it can be difficult to discern what is water and what is pine bark in the irrigated sample. However, what is apparent is the spatial distribution of water in the container.
From this orientation, the layer of water held by capillary tension in the irrigated sample, commonly called the “zone of saturation,” stands out in bright contrast from the non-irrigated sample (located between 0 and 20 mm; Figure 2). From this, quantitative data can also be collected (i.e., the depth and range of the zone of saturation). When analyzed slice by slice in either orientation, we can begin to understand the spatial distribution of water in containers. This could provide valuable insight as we strive as an industry for high-efficiency irrigation practices. While much can be gleaned from analyzing 2D slices, digitally rendering the images allows us to extract a greater amount of quantitative information from stunning 3D reconstructions.
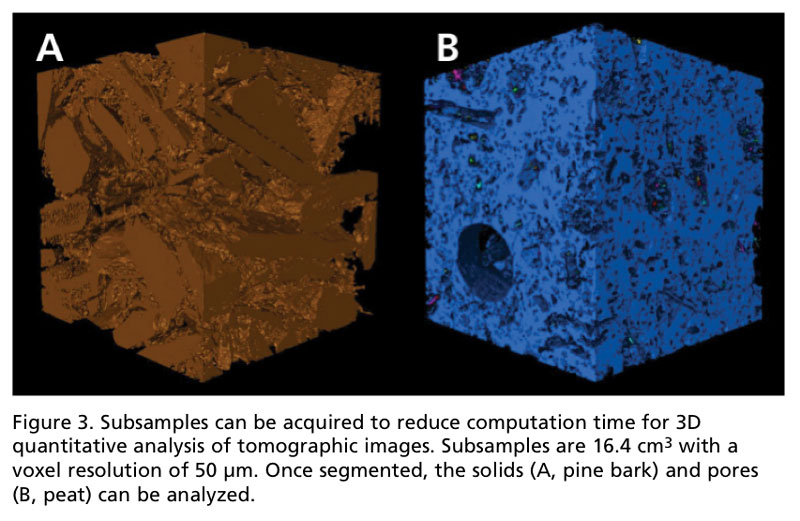
Utilizing software packages like VG StudioMax or open-source software like ImageJ allows users to digitally render their images in 3D. In order to extract quantitative data, the images must be segmented in order to separate voxels (a 3D pixel) of solids from those of air.
Once these two phases are isolated, the solids and pores can be visualized, labeled and analyzed to obtain data such as volume, surface area, number of pores and dimensional characteristics of objects. One cubic inch subsamples of pine bark and peat are displayed in Figure 3 to demonstrate the capability of isolating solids from pores for substrate characterization.
Future implications
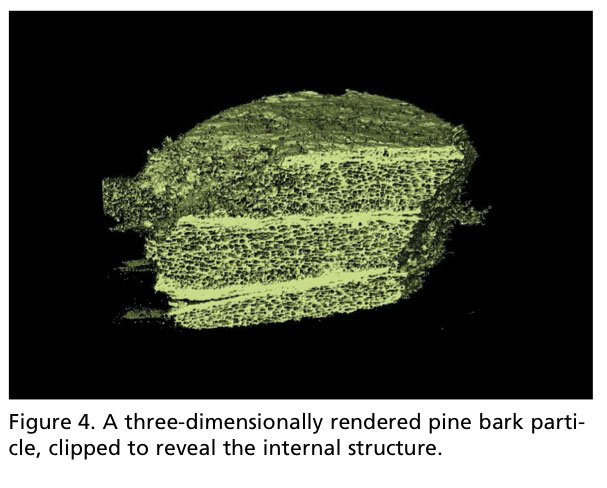
With many different substrates to choose from and many viable options available (such as peat, coir, wood fiber, etc.), what makes them different? The answer to this question likely has to do with each material’s inherent physical characteristics, both internally and externally. Remember the two layers of pine bark? A high-resolution scan of a single pine bark particle revealed the “less dense” layers between the periderm layers were in fact comprised of a complex, honeycomb-like matrix capable of retaining and releasing water (Figure 4). Matrixes like the one observed in pine bark particles may provide a slow, but connected, pathway for water movement (laterally and vertically) to plant roots.
Understanding these complex structures better may provide insight into the advantages of some substrate components over others in specific scenarios. For example, plants sold in retail stores may go prolonged periods without irrigation. A substrate with the best hydration endurance would prove more beneficial than one which quickly wets and dries.
Substrate particles and pores are closely related. After all, the reason particle size data is collected is to understand the size of the pores the particles may create. This technology could allow us to directly quantify particle size with the surrounding pore structure. After digitally rendering a pore matrix, simulated irrigation events could indicate which material or pore structure is best suited for different irrigation applications (sub-irrigation vs. overhead vs. drip). This is valuable information for our industry as it strives for precision irrigation systems and for researchers, like ourselves, in understanding the role substrates play in retaining and distributing water effectively throughout the container’s pore matrix.
With such wide-ranging implications for this type of high-tech substrate research, it’s our goal to identify as many practical applications from this innovative, foundational research. As controlled environment plant production increases in efficiency and function, so should the substrates used in these systems. GT
Paul Bartley is a doctoral student in the Horticultural Substrates Laboratory at NC State University and can be reached at pcbartl2@ncsu.edu. Dr. Brian E. Jackson is an Associate Professor in the Department of Horticultural Science at NC State University (Brian_Jackson@ncsu.edu). Bill Fonteno is a professor in the Department of Horticultural Science at NC State University (bill_fonteno@ncsu.edu).